Error detection & auto-escalation
When the cheap model keeps failing the same verified check, Shunt can move up on its own — raising the model's reasoning effort first, then its rank — without waiting for you to intervene. This page explains how a failure is detected, what makes one worth escalating, how the ladder climbs, the safety rails around it, and where it does nothing.
It ships ON (owner choice, 2026-08-08) — with the honest caveats in
Limitations: the recurrence trigger is a null detector at
the live cadence, so no measurement yet shows it to separate outcomes; the value is the ladder's,
measured observationally at session cadence (3.02× — see the
session-value figure, the authoritative committed measurement), and that
same figure shows the escalate arm losing to an always-frontier arm and tied with firing at
random at the same rate. The one claim we do make, scoped exactly, with its assumptions, its
limits and the pre-registered falsifiers that would have retracted it — two of which fired —
is the escalation claim. It is armed when a repo is resolved — escalation's only verified-failure signal is the repo's tests re-run off the wire.
The repo is resolved in order: explicit capture.work_dir / capture.work_dirs map, SHUNT_WORK_DIR env var, or the validated launch
directory (when trust_launch_dir: true, the default). With a git repo at launch, cd myrepo && shunt start captures with zero configuration.
Without any repo, a boot warning names which layer arm and says escalation is enabled but not armed; it is never silently inert.
The config knobs are in
Configuration → Auto-escalate on repeated verified failure.
Its sibling is the routing model, which picks the model before any evidence about the task exists. This one acts only after a verified outcome.
The shape of it
Two stages, and only the first one does any pattern matching.
Stage one turns a test run into a verdict and an identity. A subprocess runs your repo's suite off the wire; the exit code decides first, and regexes over the combined stdout and stderr decide the rest — whether tests genuinely ran and failed, whether this was an environment error rather than a capability one, and what to call the failure. That name is the dedup key: the first test node id the runner printed, or a hash of the failure detail with the volatile parts stripped out.
Stage two is arithmetic. No regex, no model, no learned weights: count how many confirmed, non-infrastructural failures share each dedup key inside a window of recent decisions, and fire when one key reaches the threshold. Distinct keys never add together.
flowchart TD
  IN["Input: a closed session, with a work_dir configured<br/>(never the model's own claim)"] --> P1

  subgraph PRE["Pre-processing — off-wire verification"]
    P1["Auto-detect the runner from repo files:<br/>pytest · jest/vitest · go test · cargo test<br/>· Maven/Gradle · dotnet test · RSpec/PHPUnit · …"]
    P1 --> P2["Run it; capture stdout + stderr and the exit code"]
    P2 --> P3["Classify — exit code first, then regex:<br/>success · capability failure · infra/unknown"]
    P3 --> P4["Re-run a failure to confirm it reproduces;<br/>abstain if it does not (flake guard)"]
    P4 --> P5["Derive the dedup key: first test node id,<br/>else a hash of the normalised detail"]
  end

  P5 --> EV["One failure event per closed session:<br/>dedup key · decision index · confirmed · blocking"]

  subgraph MODEL["Model — a counting rule"]
    EV --> M1{"Enabled, and no<br/>routing-collapse alarm?"}
    M1 -->|no| H1["HOLD"]
    M1 -->|yes| M2["Keep events inside stale_window decisions"]
    M2 --> M3["Count confirmed, blocking failures per key;<br/>keys never aggregate"]
    M3 --> M4{"One key reached<br/>escalate_after_n?"}
    M4 -->|no| H2["HOLD"]
    M4 -->|yes| M5["Flagged: pick the next rung —<br/>effort if there is headroom, else rank"]
  end

  subgraph POST["Post-processing"]
    M5 --> Q1["Optional ε-greedy: withhold with probability ε,<br/>and log the propensity"]
    Q1 --> Q2["Apply: raise the reasoning arm on the same model,<br/>or step to the first healthy higher-rank model"]
    Q2 --> Q3["Retire the acted-on window;<br/>mark the turn non-policy"]
  end

  Q3 --> OUT["Output: a directive for the NEXT session boundary"]
One verified outcome per session, not per step. This is the single fact most
easily got wrong about the live path. The verifier runs at session close, so the
router records at most one failure event per closed session — not one per tool call,
not one per agent action. With the shipped escalate_after_n: 2, escalation
therefore needs two sessions on the same repo failing the same check inside the
window. It does not watch an attempt unfold and intervene inside it. The offline eval
in benchmark/escalation/ replays one event per step, which is a different and
more frequent cadence; that gap is spelled out under
what the sweep does not establish.
Detection — what counts as a failure
Escalation acts on verified failures only. A model's own claim that "the tests pass" is never trusted — coding agents misreport — so the signal comes from a non-model producer: your test suite, re-run off the wire.
- Off-wire re-run. At session close, if you have configured a
work_dir, Shunt re-runs that repo's test suite off the request path and records the pass/fail as a verified outcome. The runner is auto-detected from the repo (see Which runners are supported) — pytest (Python), jest/vitest (apackage.json),go test(ago.mod),cargo test(aCargo.toml), Maven/Gradle,dotnet test, RSpec, PHPUnit, GTest/CTest, and more. Nowork_dir, no framework, no signal — Shunt writes nothing and never guesses. See Feedback. - Flake guard. A test that fails then passes on unchanged state is a flake, not a regression. A failing run is re-run to confirm; if it does not reproduce, the result is abstained (it feeds neither the router nor escalation). Only a failure that reproduces every time is passed through.
- Environment vs capability. A missing module, a broken test-collection step, or a
wrong interpreter (
ModuleNotFoundError, a pytest collection error,go: cannot find module, an unresolved Rust import) is infrastructural — no bigger model fixes a missing dependency. Shunt classifies these as environment failures and they never count toward escalation. Only a genuine capability failure — the code ran and the assertions failed — is escalation-eligible.
One caveat, for anyone measuring with this flag rather than just running on it: across the
ten repositories in benchmark/escalation/data/live/ the environment-failure rate spans
13.2% (pylint) to 0.20% (matplotlib) — a 64× spread — while barely moving with model or
reasoning effort. Do not read that as a property of the repositories. It is driven
substantially by individual broken instances: 175 of pylint's 176 infra-flagged steps
come from one instance. So any number computed from this flag, the infra_rate prefix
feature included, can be encoding which instances a split happened to contain rather than
anything the agent did. Do not read one as behavioural without controlling for instance and
repository.
- A stable failure identity. Each confirmed failure gets a dedup key: the
failing test's node id where the runner prints one (path::Test::case), or a
normalized hash of the failure detail otherwise — with timings, hex addresses,
temp paths, timestamps, randomized run seeds (a runner that prints its own
random seed: / PYTHONHASHSEED), subprocess pids, JUnit XML time="…"
attributes, and pytest's --durations
block stripped, so the same recurring failure hashes to the same key run to run.
The durations block is dropped whole rather than value-normalized: it is sorted by
time, so run-to-run jitter permutes the lines and normalizing only the numbers still
leaves the key random. That key is what lets Shunt tell "the same problem again" from
"a different failure."
Human feedback (shunt flag <id> bad) is a verified source for the routing learner — a person
confirming the result is ground truth, and it feeds the outcome index exactly like a suite. It does
not feed auto-escalation's failure log. The escalation log is held in the running engine's
memory and keyed per repo (work_dir); shunt flag runs in a separate process and writes only the
session's outcome row, so a human-flagged failure never trips an escalation. Feeding human labels
into escalation would need the failure log moved to the same store — a design change, not a wiring
detail.
Which runners are supported
The classifier that turns a test run into success / failure / environment is
language-agnostic in design and runner-specific in coverage. Every row of the matrix
below is a coverage contract — a captured pass, a genuine failure and a collection
error per family live in tests/verifiers/fixtures/, and all are classified by the
same multi-stage rule, never a per-framework parser.
| Language(s) | Runners recognized | Detected from |
|---|---|---|
| Python | pytest · unittest · nose2 · tox | pyproject.toml / setup.cfg / pytest.ini / conftest.py / a dev requirements file |
| JavaScript / TypeScript | Jest · Vitest · node:test · mocha · jasmine · karma · ava | a package.json declaring the runner, or node --test |
| Go | go test (testify / Ginkgo emit through it) |
a go.mod |
| Rust | cargo test (libtest) |
a Cargo.toml |
| Java | Maven Surefire / Failsafe · Gradle (JUnit 4/5, TestNG) | a pom.xml or build.gradle(.kts) |
| C#/.NET | dotnet test (VSTest) — xUnit · NUnit · MSTest |
a *.csproj / *.sln |
| Ruby | minitest · RSpec · test-unit · Cucumber | a Gemfile declaring one, or a .rspec |
| PHP | PHPUnit · Pest · Behat · Codeception | composer.json declaring one, or a phpunit*.xml |
| C/C++ | GoogleTest · CTest · Catch2 · doctest · Boost.Test | a CMakeLists.txt with enable_testing / add_test |
| Swift | XCTest (swift test) |
a Package.swift |
| Shell | bats (TAP) · shunit2 | *.bats files, or scripts calling shunit2 |
| Perl | prove / Test::More (TAP) | t/*.t, Makefile.PL / Build.PL |
| R | testthat · R CMD check | a DESCRIPTION suggesting testthat |
| Elixir | ExUnit (mix test) |
a mix.exs |
| Haskell | hspec · tasty · HUnit | *.cabal / package.yaml / stack.yaml |
Detection is a single multi-stage classifier, not one parser per runner, so every language gets the same treatment:
- Exit code first.
0= pass (with the nothing-ran caveat below); a signal death (128+Nor a negative code) and pytest's2/3/4/5(interrupted / internal error / usage / nothing collected) are infrastructure by definition — no bigger model fixes a session that never validly ran. The red exits are everything else:1(pytest, jest, go, Maven, Gradle, dotnet, RSpec, minitest, CTest, xctest, mix, hspec, R CMD check), cargo's101— gated on thetest result:/failures:markers, so a compile error at101is infra, not a red — and PHPUnit's1(failure) and2(errored test). PHPUnit's2is deliberately a red: itsShellExitCodeCalculatormaps a test ERROR to2, unlike pytest where2means interrupted. karma is the one marker-gated exception: it exits0even when tests fail, so itsExecuted … (N FAILED)summary is proof of a red at exit0. - Machine-readable channels first. When the output carries JUnit XML (a
<testsuite … tests="N" failures="Y" errors="Z">with<failure>/<error>testcases) or TAP (TAP version, a1..Nplan,ok N/not ok Nlines), the counts are read straight from the channel. pytest--junitxml, SurefireTEST-*.xml, Gradle test-results, PHPUnit--log-junitand gtest--gtest_output=xmlemit the first; node:test, bats, prove and tasty emit the second. Only when neither channel is present does the regex fallback run. - Positive proof a test ran and failed — pytest's
FAILED <nodeid>andN failedtails, Go's--- FAIL:, Rust'sfailures:block, Jest'sTests: … N failed, Maven'sTests run: … Failures: N, dotnet'sFailed!, RSpec / minitest'sN failures, PHPUnit'sFAILURES!/ERRORS!, gtest's[ FAILED ], CTest'sThe following tests FAILED:, xctest'sTest Case '…' failed, ExUnit'sN tests, M failures, and each family's count-summary line. These win over every "environmental-looking" phrase below, because an assertion can quote any of them verbatim (assert "cannot find module" in out). - Environment / collection markers only when no run-and-failed proof exists —
import / compile / link failures (
ImportError while importing,cannot find module,unresolved import/error[E…],COMPILATION ERROR,error CS…,Build FAILED,fatal error:,cannot load such file,PHP Fatal error:,could not find module,Can't locate … in @INC), plus a selector that found nothing to run. - Nothing-selected is never a pass —
0 passed,collected 0 items,no tests ran,Ran 0 tests,no test files, a TAP1..0plan or a JUnittests="0"mean no measurement, unless the same run also counted at least one passing test (a real green tail overrides its own absence marker).
The dedup key — what makes a recurring failure "the same failure" — is likewise
language-agnostic: the first test node id the runner prints (path::Test::case,
path::case, file::Test::case), or a hash of the failure detail with run-to-run
volatility (timings, addresses, temp paths, timestamps, XML time="…" attributes,
random seeds, pids) stripped.
Coverage is a starting point, not a ceiling. The marker vocabularies are enumerated per family above, but the classifier's shape — exit code, machine- readable channel, positive proof, environment markers, absence markers — is deliberately runner-independent, so adding the next runner (sbt, pytest-describe, dart test, …) is a vocabulary addition plus a fixture test, not a new mechanism. A run that prints none of the markers and exits with a code that says nothing is classified unknown — never a fabricated pass — which keeps the rule safe until the vocabulary catches up.
Triggers — when it escalates
One failure is not enough. Intermediate fail-then-fix is normal, so a single verified failure never escalates. Shunt escalates only when the same verified failure recurs:
- The same key,
escalate_after_ntimes (default 2) withinstale_windowdecisions (default 10). Two reds on the same failing check inside the window trip it. The default is a prior, not a tuned value: under the counter the product actually runs (theas_shippedsweep family) every low threshold sits at chance, so nothing measured prefers 2 to 3 or 3 to 2 — see what the sweep does not establish. - Different failures don't aggregate. Two verified failures with different keys are two different problems — that is the kNN store's job to learn from, not a signal to escalate. Only same-key recurrence counts.
- A window that goes quiet retires. A failure that does not recur within
stale_windowdecisions is dropped from the counter, so an old, since-fixed problem cannot trigger later. - Success clears the slate. When the whole suite goes green, every pending failure for that repo is retired — the router saw the problem resolve.
- One escalation consumes its evidence. After Shunt steps a rung, the failures it acted on are consumed. Climbing the next rung requires a genuine fresh recurrence — two more verified same-check reds — not the same two firing again.
Escalation is keyed per task (the repo / work_dir), so a repeated failure in one
project never escalates routing for another.
The sameness premise is now testable — and the stamp is a whole-spec gate, not an error id
"The same failure twice means the model is stuck" is a design assumption. The obvious way to
check it is to compare runs that repeat one failing-check id against runs that hit several. The
current corpus supports that comparison. The trajectories in benchmark/escalation/data/live/
were re-stamped (2026-08-02) by the grader-parity container replay (swebench_grading.GraderParity),
and every one of the 18 339 failing-check ids on disk is a readable test name — a FAIL_TO_PASS or
PASS_TO_PASS id taken from the instance's own SWE-bench spec. Zero opaque hash:… keys remain;
django keys are test_x (module.Class.test_x) ids, sympy keys are bare test names, sphinx keys
are file::Test::case node ids. An earlier version of this section described a pre-rebuild corpus
whose keys were per-instance hashes and whose sympy runs fabricated passes; that corpus is gone.
What the stamp actually measures, so the premise is read correctly:
- It is a whole-spec gate, not the agent's error. Each step replays the agent's workspace at
that step and runs the instance's target test files; the step is red while the F2P∪P2P set is
not fully green, and
failing_check_idis the first test in that set that is still failing. Agit log, acat, and a fullpytestrun are all stamped the same key while the target test fails — the stamp is state-contingent, never action-contingent. - Same-key recurrence is therefore a per-instance time-to-fix counter. The F2P set is fixed per instance, so a constant key from step 0 to the fix (or to the terminal step) counts how many replay steps the spec stayed red. Resolved runs break the streak exactly at the fix and never end red; unresolved runs repeat the same key until the terminal step. A key change mid-run is meaningful but rare (~8% of runs): it means a different graded test now leads (partial fix, or a P2P regression after the F2P set passed).
- The recurrence edge this produces is real but partly run-length. Because the counter
starts at the first reproduction failure, the shipped
escalate_after_n: 2fires on nearly every run, and the discrimination that emerges at high thresholds trades on long runs. Measured over the 723 stamped runs: the n=30 cell's AUROC 0.658 is only 0.097 above the 0.561 that run length alone scores at the same flag count, and it clears a length-stratified null (0.658 against [0.536, 0.582]) — so recurrence adds signal beyond length, but about 40% of the raw excess over chance is the length selection. The policy sweep in Results → Escalation reports both references on every cell.
The question is no longer untestable. Whether same-key recurrence, key diversity, or neither predicts failure is what the policy sweep measures; it is not reported here as an unconditional "same-key wins" claim because the honest answer carries the run-length caveat above. Two residual defects stay on record: a step that could not be reconstructed is stamped green (unmeasured, not passed — ~7% of steps, on 310 of the committed corpus's runs), and the key names the spec's test, so "same error" is "same graded test still failing", which is the state the whole-spec gate measures.
The ladder — effort first, then rank
The default ladder is effort_then_rank, and it climbs one rung per step — where a
rung is a reasoning arm, or a shortlisted rank rather than every rank:
- Raise reasoning effort first. The router bumps the current model up one
reasoning arm (e.g.
medium→high). It is the same model, so the provider's prompt-cache namespace is unchanged — this rung is cache-safe. The higher arm's request params are applied to the outbound call, overriding any the client sent. - Then step a rank. Only once the model's reasoning arms are exhausted — or if the model declares no reasoning arms at all — does the router step up a model rank. The new model starts at its own default arm, not mid-ladder.
- Hold at the top. At the ceiling (top rank, top arm) escalation holds rather than thrashing.
The rank rung is a shortlist, not every model
Rank order is price order. So a ladder that stepped one rank at a time would buy every
model between the cheap end and the frontier — and each of those intermediate rungs is
only left after another escalate_after_n verified recurrences, so it costs sessions
as well as money. On a task that keeps failing, those mid-tier models are paid for on the
way to a frontier model the task was going to need anyway.
So the rank rung walks only the rank_shortlist cheapest ranks individually (3 by
default), and the rung that leaves them jumps straight to the top rank. With seven
live models the ladder reaches the top rank in three rank rungs (deepseek → glm-5.2 →
a frontier slot → jump) and never bills ranks 3–5. The shape mirrors the offline
Price-Cascade strategy's shortlist
(benchmark/routing/strategies/price_cascade.py) — the cheap end of the ladder, then the
escalation target of last resort — because that is the shape whose cost this repo has
actually measured. Set rank_shortlist: 0 to restore the every-rank walk.
The default of 3 is measured, and on the benchmark replay it bought a rung measured
harmful. Both halves of that matter, so both are stated — and note the pool caveat:
the sweep below runs the benchmark's replay ladder, which still prices gpt-5-mini
(benchmark/benchmark.yaml keeps it for measurement). The SHIPPED live pool has since
dropped the dominated models, so the live ladder no longer buys the harmful rung; the
sweep still governs the knob's cost shape. Sweeping rank_shortlist over {0,1,2,3,4,5}
on the committed corpus moves pass rate not at all — 97.24% at every value, with an
identically zero paired per-task difference, because the ladder reaches the same
terminal rung either way and only spend changes. On cost, 0, 4 and 5 are strictly worse
than 3 (intervals exclude zero, both cost models). The one candidate to beat it,
rank_shortlist: 2 — which drops gpt-5-mini from the replay ladder — is cheaper on
naive cost (−$1.96, 95% CI [−3.49, −0.51]) but not distinguishable on cache-aware
cost (−$1.09, [−2.20, +0.10]), and cache-aware is the cost model that governs here. So
the default stays 3 on the evidence, not on inertia. rank_shortlist: 1 cannot be quoted
at all: its replay fails its own positive control, because a ladder with no intermediate
rung cannot track planted depth.
That leaves a real defect unfixed rather than hidden — though the pool change has
narrowed it. The three dominated models (qwen3.7-plus, gpt-5-mini, kimi-k2.5) are no
longer in the shipped router's live pool, so the ladder can no longer buy them; its
first rank step now lands on glm-5.2, the cheapest target measured net-helpful.
What remains is that kimi-k3 — the best-measured rung — is still skipped: its price
slot (between glm-5.2 and the frontier tail) falls inside the rank_shortlist
walk, so the jump to the top rank passes over it. That skip is an artefact of the
price order, and it depends on the RESEARCH-ESTIMATED prices of the frontier tail. No
rank_shortlist value can express "drop the frontier slot, keep kimi-k3", because
the knob selects a prefix of the price order and the measured capability order is a
different order entirely. Fixing it needs a capability-ordered ladder, which is a
feature and not a setting — src/shunt/router/capability_rank.py currently ships the
price prior verbatim. Read this section with
the ladder-rungs figure, which carries the per-rung numbers.
The jump is bounded on both sides:
- It never overshoots. The top rank is the ceiling; past it escalation holds.
- It never lands below the rank the task already climbed to (the floor, below), and the next rung is measured from that floor rather than from a cheaper model a health gap forced onto the task.
- An unhealthy target degrades once, not rung by rung. If the top rank — and everything above the target — is unavailable, the router serves the most capable healthy model still above the current one. It does not quietly fall back to stepping one rank at a time through the mid-tier the shortlist exists to skip.
A rank step buys price, not measured capability. Rank is a model's position in the
registry, and the registry is ordered by price — which is not a capability ordering. On
Shunt's own benchmark that ordering inverts: the cheapest enabled model out-scores several
models priced well above it, so stepping one rank up can lower the pass rate on your
workload. The per-rung evidence is drawn in
the ladder-rungs figure — measured against the cheap base
model, rung by rung, with the shipped shortlist's own visit path beside it — and the
measured per-model table is in
Results → How to read this page; check both against your
own registry before you trust the ladder. The effort rung has no such problem — it is the
same model at a higher reasoning arm — which is why effort_then_rank is the default and
why rank_only deserves the more careful look.
Set ladder: rank_only to skip the effort rung and step ranks directly. The effort
rung needs a model that declares reasoning arms;
a model without them has no effort headroom and steps rank immediately.
A climbed rank sticks until the tests go green
Base routing has no memory of the ladder. Cold start serves a fixed cheap model and the kNN router re-picks from the corpus of past outcomes; neither knows this repo already climbed a rung. So Shunt remembers the rank a task escalated to and re-serves it at the start of every later decision for that task — across sessions, and across a restart.
That memory is what makes the ladder a ladder. Without it the next session drops back to the cheap model, fails the same check, and climbs the same single rung again. And again. A task could never reach the frontier no matter how often it failed.
What the floor does, precisely:
- Keyed per task — the same repo (
work_dir) identity the failure log uses. One project's floor never lifts another project's routing. - Held, not climbed. Re-serving a rung escalates nothing, so the decision reports
escalation_floor, notauto_escalation. The model is still imposed by the failure signal rather than chosen by the policy, so the turn is marked non-policy exactly like an escalated one — the learner never trains a forced model as a free choice. - It only ever goes up. A transient health gap that forces a cheaper pick cannot lower a floor the task already earned. If every model at or above the floor is unhealthy, Shunt serves the base pick rather than failing the request.
- Success retires it. A verified green suite drops the rank floor and the reasoning-effort arm together, and the task returns to ordinary base routing. The pass is the evidence it is no longer stuck; holding the floor would pin the repo to an expensive model on the strength of a bug that is already fixed.
Safety — the rails
- Never mid-cached-turn. An escalation applies only at the next session boundary. Shunt never switches a model in the middle of a cached conversation, which would force a full-price re-read of the context. Cache-safety is preserved by construction.
- Routing-collapse guard. If the recent model-choice distribution is degenerate —
the expensive tail dominates, or choice-entropy collapses — a routing-collapse alarm
suppresses further escalation so the router cannot ossify onto costly models.
The guard abstains during cold start: the cold-start router defaults every
session to one cheap model, so its choice distribution is degenerate by design and
the alarm must not fire on that state (it would globally suppress escalation exactly
when verified failures first accumulate). The same signal is exposed at
GET /admin/loop-health. - Escalated turns don't train the policy. An escalation is imposed by the failure
signal, not chosen by the policy, so an escalated turn is recorded as non-policy: its
selection propensity and candidate scores are neutralized, and it opens a fresh label
window. The learner never mistakes a forced escalation for a free policy win. The
recorded rule is restated too:
selection_rule_usednames the rule that produced the model that ran, so after an escalation it readsauto_escalation(a rung was climbed) orescalation_floor(the task's remembered rank was re-served) — never the base pick's rule. - State survives a restart. The failure log, the per-task reasoning-effort arm and the per-task rank floor are all snapshotted, so a restart resumes a half-climbed ladder rather than forgetting it and starting the climb over.
What the escalated model is told — context_transfer
When a rung is climbed, the next session runs on a different model, and your CLI resends
the whole conversation to it. That prefix is a cache miss by construction — a new model
means a new prefix — so the escalated turn pays full input price for everything said so far.
escalation.context_transfer is the knob over what happens to that inherited conversation.
| Value | What shunt forwards |
|---|---|
full (default) |
Your messages, untouched. Pure pass-through, exactly as shunt has always behaved, and what every published cost number assumes. |
summary |
On the first turn after an escalation that changed the model, shunt replaces the prior conversation with a handover note it authors, then freezes that note and resends it byte-identically on every later turn. |
It fires on a rank rung, never an effort one. The effort rung keeps the same model precisely so the cache namespace — and the warm prefix — survives; substituting a summary there would turn a cache hit into a miss and pay for a summariser call to do it. Only a step that hands the conversation to a model which has never seen it is a transfer at all. A resumed conversation never authors one either: it continues on an already-locked model, so there is no escalation boundary to compact at. If the conversation it resumes had already been summarised, the frozen note is restored with the model and re-sent unchanged — the decision is not retaken, and the prefix stays warm across the resume.
summary means the model does not see what you see. This is the one place shunt puts
words into your conversation rather than carrying it, so it is off by default and it is
disclosed everywhere it can be:
- a boot warning naming the writer and the token ceiling;
- a line on
shunt doctor, under the escalation check; - an
X-Shunt-Contextresponse header on the turn the substitution happens; - a
Context:line inshunt explain <session>, saying who wrote the note and how many messages it replaced.
The note is written by the outgoing, pre-escalation model (override with
context_transfer_model). That model is the cheap one and its prefix is already warm, so it
re-serves a cache hit; asking the incoming model would pay exactly the uncached prefill the
feature exists to avoid. The note is frozen on the session for the same reason: a summary
regenerated per turn is a cache miss per turn, which costs more than full.
Anything that goes wrong — an error, a timeout, an empty answer, a note over
context_transfer_max_tokens — degrades to full, with a WARNING and a
degraded_reason recorded in the session's provenance. One attempt, no retry loop. Context is
never silently dropped: the fallback is the expensive-but-correct path.
What we have actually observed, and what we have not. On a live rig, an escalated turn
under summary sent roughly a fifth of the tokens the same conversation sent under full
, and the frozen note
behaved as designed — the prefix stayed fixed while only the tail grew. That token reduction
is the bulk of the saving and it is measured. What is not measured is the second-order
benefit: on that run the provider reported no cache read for the frozen prefix on later
turns, most likely because the note was too short to meet the provider's minimum cacheable
prefix. We could not separate "below the provider's threshold" from "shunt is not presenting
a cacheable prefix", so treat the warm-prefix half of the rationale above as an intended
mechanism rather than a demonstrated one. full remains the default, and every published
cost number assumes it.
What it writes to disk. Restoring a frozen note after a restart means restoring the exact
bytes, so the note and the leading system blocks it was built from are stored in the session
row (decision_provenance.context_transfer_prefix) in plaintext, in shunt's local SQLite
database. For a coding agent those system blocks routinely carry your working directory, git
status and recent commit subjects. Nothing is redacted and the file is not encrypted — its
protection is filesystem permissions. This applies only with summary enabled, which is off
by default; under full no conversation body beyond the session's opening prompt_text is
written. See SECURITY.md for the
data-at-rest summary.
There is deliberately no none. Shunt can drop context from the request it forwards, but it
cannot make your CLI forget — the client resends its history every turn — so none would have
to strip on every turn, and the strong model could never accumulate state. That is a broken
router, not a transfer mode.
Why it is built this way
The design is mostly a series of refusals, and each one is worth knowing before you rely on it.
- The signal comes from a process the model does not control. A model grading its own work is the cheapest verifier available and the least trustworthy. Re-running your suite off the wire costs one subprocess per session and buys a label the agent cannot talk its way out of.
- Counting, not scoring. A learned risk model would need a corpus of labelled failures to train on — the thing this loop is still collecting — and would have to be trusted before it could be checked. A count has one parameter you can read off the config. This is the simplest rule that could work, picked so its failure modes stay legible; it is not the end state.
- Recurrence, because a first failure is ordinary. Fail, read the traceback, fix: that is the loop working. Escalating there spends frontier money on a model that was about to succeed anyway. A second identical failure is the first evidence that reading the traceback did not help.
- Two failure classes are excluded because no larger model repairs them. An unreproducible failure is a flake; a missing dependency is a broken environment. Escalating on either buys a pricier model for a problem that was never about capability.
- One rung at a time, effort before rank. The cheapest intervention that could plausibly work goes first, and the effort rung keeps the same model — so it does not cost you the prompt cache. Jumping straight to the top would be simpler to implement and would spend the most on the least evidence.
- At the boundary, never inside a turn. A mid-conversation switch forces a full-price re-read of the cached context. Any escalation that could only pay off by breaking the cache is not worth having, so the directive waits for the next session.
Limitations — read before relying on it
Be honest with yourself about where this does nothing:
- Ships ON, but the trigger is unproven at the live cadence. No measurement yet shows the shipped recurrence counter to separate outcomes (as-shipped it fires on 723/723 offline runs at the base rate; its only real edge is the eval-only edit-gated family production cannot run). The value is the ladder's, measured observationally at session cadence (3.02×, as committed in the session-value figure) — against a cheap retry. Against the trivial arms in that figure's third panel the escalate arm does not win: it loses to always-frontier on quality and is indistinguishable from firing at random at the same rate, and the arm it measures is the corpus's two most expensive models (glm-5.2, kimi-k3) — the shipped ladder's first rank step is now glm-5.2, and it never reaches kimi-k3. Treat it as a mechanism with positive but not-yet-identified value; the ε-greedy + logged-propensity path is how it becomes measurable. The full-policy cost read over all 48 overlap tasks is computed and is sound on money, but its two arms differ in outcome on none of those tasks, so it cannot carry a cost-at-equal-quality claim. What we are and are not willing to assert, and why the cost fallback does not hold either, is the escalation claim — which also lists what it would take to move any of this past pre-alpha.
- No repo resolved, no automatic signal. Auto-escalation is inert until Shunt can resolve
and test a repo. Without one, auto-escalation has no signal at all:
shunt flagfeeds the routing learner, not the in-process escalation log, so a task with no resolvedwork_dirproduces no verified failure the escalation rule can count. A repo is resolved if explicitly configured, supplied viaSHUNT_WORK_DIRor--work-dir, or auto-detected from the validated launch directory. The router warns at boot which layer (if any) is armed; it is never silently inert. - No tests, no signal — the vibecode case. A repo with no test suite produces no verified outcome, so auto-escalation does nothing there. It cannot escalate on a signal that does not exist.
- It needs repeats across sessions, not within one. Because the verifier runs at session close, a session that fails the same check twenty times internally still contributes one event. Escalation is a between-session mechanism; nothing here rescues a single attempt that is going badly while it is going badly.
- A runner with unstable output can never accumulate recurrence. When no test node id is printed, the key is a hash of the failure detail, and the normalizers strip only the volatility we have enumerated — timings, addresses, temp paths, timestamps, seeds, pids, duration blocks. A runner that prints some other per-run-varying string hashes to a fresh key every time, so the same failure never looks like a recurrence. The field stays populated, which is what makes this quiet: it looks like it is working.
- It grades nothing. This is a counting rule, not a risk model. Every confirmed blocking failure counts exactly one; there is no severity, no confidence, and no score you can threshold differently. A trivial assertion and a total collapse are the same event to it.
- SWE tasks only. The verified signal is a repository's own test suite. Work with no runnable check — analysis, prose, a spreadsheet — produces nothing for this mechanism to act on.
- The effort rung needs reasoning arms. A model that declares none skips straight to a rank step; there is no effort headroom to climb.
- Runs where Shunt sits beside your code. The off-wire re-run needs the repo and
its test toolchain on the same machine — a plain
shunt starton your dev box. A slim container has neither unless you mount them; there, useshunt flagviadocker exec. See Feedback → by deployment. - A pre-human-label mechanism, still being proven. This is the day-one learning signal that works before any human-rating flow exists. Whether cheap-first routing plus verify-and-escalate beats always-frontier at equal quality is what Shunt is still validating; it ships ON, but treat it as unproven (consider disabling it) until that holds for your own workflow.
The benchmark measures a different cascade from the one inference runs
Every published cascade number is an offline replay, and the replay and the running router do not climb the same ladder.
Offline, each rung starts from a fresh tree and a fresh context: the attempt is scored as
if the stronger model had been handed the original task, untouched. Live, the escalated model
inherits a dirty tree — the cheap rung's edits are still sitting in your repo — and,
because shunt never rewrites messages, it also inherits the whole prior conversation,
resent by your CLI and uncached.
Two consequences, and they are not symmetric:
- The cost gap is priced, roughly. Carrying that conversation is a cache miss by
construction, so it is charged at full input rate. The dashed bracket in the magnified
panel of the frontier figure re-prices both
deployable escalating strategies, ticked at
summary(drawn as a band, because a summariser's compression ratio is not a constant) and atfull, the shipped default. The marker the bracket hangs from is what the offline benchmark measures — a fresh context on every rung, which no config setting reproduces. It is a cost model over measured tokens, not a measurement, andcontext_transfer: summaryabove exists to shrink that end of it. - The quality gap is not priced at all. The assumption that a fresh-tree rung and a dirty-tree rung reach equal quality is untested, and testing it is N² expensive — every rung would have to be re-run from every predecessor's leftovers. Worse, the workspace difference is a confound in an unknown direction: escalation only fires on a confirmed RED tree, so the escalated model starts from a problem that is partially solved (which may help it) and partially wrong (which may mislead it). Nothing in this corpus separates the two, so we do not claim a sign, let alone a size.
Read every cascade cost as an offline lower bound whose live quality is unestablished in either direction.
Pros and cons at a glance
Why use this model. Because a model's self-report is the least trustworthy signal available, and a re-run of your own tests is the cheapest one that cannot be talked out of. The decision is a count you can read off the config — no learned risk model you would have to trust before it was checked — and it only ever acts at the next session boundary, so it cannot break the prompt cache. The rationale and the full limitations are above; the table is the summary.
| Pros | Cons |
|---|---|
| Verified: re-runs your suite off the wire, never trusts the agent | Inert without a resolved repo, and inert on a repo with no tests |
| Counting rule — one parameter, fully inspectable | Grades nothing: a trivial assertion = a total collapse |
| Recurrence, not a single red: intermediate fail-then-fix never escalates | Needs repeats across sessions; nothing rescues a failing session in flight |
| Effort-first rung keeps the same model → cache-safe by construction | Effort rung needs a model that declares reasoning arms |
| Different failures never aggregate; success clears the slate | An unenumerated runner's volatile output never accumulates recurrence |
| Escalated turns are non-policy; collapse guard caps runaway escalation | Ships ON, but the trigger is unproven at live cadence (null detector); ladder value observational |
| SWE-only by design today, but runner-extensible (see above) | Requires Shunt beside your code + toolchain on the same machine |
| Every published cascade number is an offline replay from a fresh tree; a live rung inherits a dirty one, in an unknown direction |
Turn it on (it is already on — arm it)
Escalation ships enabled and is configured through router.yaml — there is no escalation config override flag
(shunt start --config-override '...' does not exist). What arms it is a resolved repo — explicit config,
the --work-dir flag, or the validated launch directory. To arm escalation, set the work_dir
(and, if you want a different threshold than the shipped prior, the escalation knobs) in your router.yaml:
router:
  capture:
    work_dir: /path/to/your/repo   # Optional — explicit repo; auto-detected from launch dir if not set
  escalation:
    enabled: true                  # shipped default; only present here for explicitness
    escalate_after_n: 2            # same-key verified failures before a step
    stale_window: 10               # a failure not recurring within N decisions retires
    ladder: effort_then_rank       # or rank_only
Enabled without any resolved repo is not a load error, but the router warns at boot which layer (if any) is armed; if none, escalation is enabled but not armed.
The full knob reference is in Configuration.
Which base strategies the ladder applies to
The ladder is a layer over base routing, not part of any one algorithm — but it does not
apply to every strategy. always_cheap and always_frontier are pinned controls: a
verified failure never moves them, because they are the baselines a routing comparison is
read against. The two strategies the ladder runs under are the ones named for it:
session_cascade (the default — the cheapest model, then this layer) and knn_semantic_cascade
(the kNN pick, then this layer). Both are refused at load if you turn the layer off.
See Choose the strategy.
What it is not, and cannot become: a cascade inside one task. Shunt makes one model decision per session and never switches mid-turn, so it cannot run the cheap model, read your tests, and retry on a bigger model within the same task. The ladder's unit is a session; the rung it climbed persists for the repo, so the cascade happens across your next few sessions instead of inside this one. Results prices that difference.
Measuring whether escalation actually helps
Turning escalation on tells you nothing about whether it worked. A deterministic policy escalates at every checkpoint it flags and nowhere else, so the logs contain no case where a flagged checkpoint was left alone. There is no comparison to make — not a noisy one, none. Any "escalation improved things" read off such logs is a difficulty proxy: escalation fires on the runs that were already going badly.
exploration_epsilon fixes that by withholding the escalation at a small random fraction of
flagged checkpoints and recording the probability that generated each choice:
router:
  escalation:
    enabled: true
    exploration_epsilon: 0.2    # withhold ~1 in 5 flagged escalations
    exploration_seed: 20260728  # optional; omit and shunt draws + records one
It is a separate opt-in: enabled: true on its own never randomizes anything, and
exploration_epsilon: 0.0 (the default) is today's behaviour bit for bit.
What gets recorded, on the session's decision provenance, at flagged checkpoints only:
| Field | What it is |
|---|---|
checkpoint_id |
The recurring failing-check id that flagged this checkpoint |
action / policy_action |
The arm taken, and what the deterministic policy would have done |
propensity |
P(action taken) — 1-ε for the escalation arm, ε for the withheld arm |
epsilon, seed |
Enough to re-derive the draw after the fact |
features |
The state as of the decision — failure counts, distinct keys, ladder headroom |
randomized |
false for a checkpoint with no rung left to climb; those are excluded, not weighted |
Separately — on every boundary the ladder actually evaluated and could name a hold
for, flagged or not — the provenance carries escalation_hold_reason: the token naming
why nothing was escalated. It is one of
collapse_suppressed (the routing-collapse guard fired), no_recurring_failure (no
same-key recurrence reached the threshold), escalation_ceiling (top rank and top
reasoning arm — nothing left to climb) or exploration_hold (ε-greedy withheld the rung).
Without it a held boundary is indistinguishable from one where escalation never ran at
all, so a hold breakdown could not be derived after the fact. A router with escalation
enabled: false records no token, because it takes no escalation decision to explain.
The decision function carries a fifth token, disabled, for a disabled configuration —
but a live router cannot emit it. Escalation being off is decided before the ladder
runs: the engine resolves no task identity for the session and returns the base decision
untouched, so the ladder is never consulted and no provenance is written. disabled is
therefore structurally unreachable from the serving path, and the hold breakdown drawn
from these tokens carries it as a permanently empty category rather than a real one.
One further case carries no token either: when a directive says raise but the rung cannot be delivered — no arm above, or every higher-rank model unhealthy — the engine returns early with the served model unchanged. That is a hold in effect, and it is recovered from the voided exploration record rather than from a token, so a token breakdown is a lower bound on holds (see the live router).
Three properties worth knowing:
- It cannot cost you cache. The explored arm is always hold. Randomizing can only withhold an escalation, never invent one, so it introduces no model switch the deterministic policy would not have made — and the directive still applies at the next boundary.
- It is reproducible. Given the seed, the sequence of draws is exact, so a logged propensity can be audited rather than trusted.
- It costs quality while it runs. You are deliberately declining some escalations. Turn it off outside collection windows.
Read the logs back with the estimator that ships in shunt.analysis.ope:
from shunt.analysis.ope import always_escalate, estimate_policy_value, rows_from_records
from shunt.db.store import OutcomeStore

store = OutcomeStore()
result = estimate_policy_value(rows_from_records(store.escalation_exploration_rows()))
print(result.status, result.dr_estimate, result.ci_low, result.ci_high)
It reports a doubly-robust estimate of a target policy's value with a 90% bootstrap interval —
or status == "not_identified" with every numeric field None, which is what you get from
logs that contain no randomization, only one realized arm, or no verified outcomes. That refusal
is deliberate: the estimator will not hand you a number the data cannot support.
Evaluating the detector offline
Before you trust the trigger on live traffic, you can measure it — offline, at no API
cost — against stored agent trajectories. The benchmark/escalation/ harness replays the
exact same decision the live router uses over per-decision trajectories and sweeps its
knobs, so you can see where it fires, how early, and at what precision.
Run it end-to-end:
make escalation-eval
# equivalently: uv run --extra benchmark python -m benchmark.escalation.run_eval
# figures land in docs/assets/figures/escalation/; pass --plots-dir to write them elsewhere
The --extra benchmark flag (baked into the Make target) is required — it pulls the
eval deps (matplotlib, swebench, …); a bare uv run strips them.
The session_value figure and the session-cadence block of the report headline whichever
registered escalation decision is under test. --policy escalate (the default, and the
only one that reproduces the committed metrics.json bit for bit) is the shipped decision
— escalate the next session to a frontier model once a cheap session failed. Pass
--policy always_cheap to headline the never-escalate hold policy, --policy
always_frontier to headline never-be-cheap, or --policy cheap_retry to headline the
same-cost retry incumbent; the selected policy is dropped from the comparisons, and a
non-default selection is recorded in the session-value payload so its numbers cannot be
misattributed to the shipped escalate arm. Read a non-default run's escalate-keyed
fields (escalate.rate, paired_difference, lift) as the headline policy's numbers —
the JSON shape keeps those keys for backward compatibility and only the policy field
says which policy they belong to; with --policy cheap_retry the escalate/retry contrast
is 0 by construction (headline and incumbent are the same arm). An unknown policy name is
a usage error naming the allowed set.
It prints a JSON report and two metric tables to stdout, and renders the figures. The eval has two independent blocks, because they answer different questions:
1. The policy, graded per trajectory. The shipped recurrence policy is replayed over each
stored run and asked the question the product actually asks: given it fired, is this run more
likely to fail? One row is one trajectory (not one prefix), n_escalated is per configuration,
and every rate carries a 95% challenge-level bootstrap interval next to the corpus base
failure rate. The bootstrap resamples whole challenges rather than rows, because runs on one
challenge are correlated and a row-level interval is too narrow; the fired and not-fired arms
are estimated from the same resamples, so the two are comparable. Read P(fail | fired)
against base: an interval containing the base rate is a configuration with no measured
value, and an interval below it means firing predicts success. The sweep varies both
escalate_after_n and stale_window — they are coupled, since reaching n recurrences needs
a window at least that wide — so the grid spans escalate_after_n ∈ {1, 2, 3, 4, 5, 6, 8, 10,
12, 15, 20, 25, 30, 40, 50} × stale_window ∈ {10, 1000} (30 cells). The dense ladder traces
the full precision/recall mapping so you can pick an operating point — production should pick
a LOW escalate_after_n (escalate early, before a doomed run burns its budget) — and both
knobs are already live configuration: escalate_after_n and stale_window in the
escalation: block of src/shunt/config/router.yaml. The shipped configuration is guaranteed
a cell and is reported separately, never adopted by argmax.
The report ALSO replays the same grid in a second family, count_from_first_edit: failures
before the agent's first edit-like action are treated as the reproduction phase (the target bug
at t=0) and are not counted. This is why the shipped threshold looks like a coin flip at all
— the as-shipped counter trips on every run's reproduction failures — and it is where the real
edge lives. On the current corpus the edit-gated family separates at the shipped threshold
— at the shipped escalate_after_n=2 it fires on 431/723 runs with P(fail|fired)=0.589
(lift 1.41) and AUROC 0.710, and the family's best cell, n=3, reaches 354/723 at
P(fail|fired)=0.638 (lift 1.53) and AUROC 0.722, clearing both the family-wise and the
length-stratified nulls; the as-shipped n=2 cell fires on 723/723 at the base rate. The two
families are reported side by side (PR/ROC curves draw both; the edit-gated sweep gets its own
table figure), and best_skilled_cell reads across them. count_from_first_edit is an
eval-only knob: the live router has no per-step action stream to gate on, so the edit-gated
family measures what a per-step detector could do if it only counted failures after the agent
first tried to change the code.
2. A prefix risk model, graded against the null. A continuous risk score — the probability this run ends unresolved — is fit from prefix-only features at fixed decision depths and evaluated out-of-fold. Three numbers are reported and only the last one is meaningful:
prior— the router's own t=0 knowledge: the per-challenge failure rate estimated from train folds only, which is what a router meeting an unseen instance actually has. Task identity alone is a strong predictor, so any unconditional number mostly rediscovers task difficulty.prefix— out-of-fold discrimination from the prefix alone.incremental—AUROC(prior + prefix) − max(AUROC(prior), 0.5). This is the number that decides whether escalation is worth anything. Everything else overstates it. The comparator is floored at chance so an anti-predictive prior cannot be beaten into an apparent finding.
The reported ladder is a single depth, 10 — the shallowest depth this corpus can score
full-rank. Depth 5 is dropped: its design is rank-deficient (the first five replayed steps are
all bug-reproduction, so almost every row carries the same feature vector). Depth 20 is
dropped too: at that depth the admission test selects failures, so its incremental measures
selection rather than prefix evidence. On the current corpus this half reads NO_SKILL
(prefix AUROC 0.478, incremental −0.022, minimum detectable effect ≈ 0.59) — it is the
secondary, honest instrument; the measurable edge belongs to the policy half.
Two things this sweep does not establish
It does not measure the cadence the product runs. Live, a verified outcome is produced
once per closed session: the off-wire verifier runs at the session boundary and the router
records at most one failure event per capture. The offline replay emits one event per step
— it walks a stored trajectory and asks the escalation runner for a directive at every
decision, so an 8-step run yields 8 events. Every trajectory in
benchmark/escalation/data/live/ is a single session (one per committed file, distinct ids —
trajectory and step counts via benchmark.escalation.corpus.census()). At the live cadence
each would contribute exactly one event, and the shipped
escalate_after_n: 2 could not fire even once on the whole corpus. So what the sweep measures
is recurrence within one session's steps, which is not the quantity the shipped rule counts.
Any escalate_after_n result it reports — including a cell it flags as better than the
default — describes a per-step policy Shunt does not run.
That gap is a property of the data, not a bug awaiting a patch. A true session-cadence replay
needs trajectories spanning several sessions; none of these do, and the report's
session_value figure is the closest the corpus allows — it reads the several (model, arm)
sessions per instance as repeated attempts at one task, which is observational rather than a
causal replay. Closing the gap fully takes new collection, not new code.
It does not exercise the flake guard. The live trigger discards any failure that did not
reproduce on re-run (confirmed=False). Offline, the stamping stage sets confirmed=True on
every step it touches, and the container replay runs each step's target tests exactly once —
there is no second execution a genuine confirmation could come from. Every replayed event
satisfies the guard by construction. Its effect on the policy is therefore unmeasured, not
measured and found to be nil. Read every sweep result as the policy's behaviour with the flake
guard switched off.
What the rest of the report means:
statusis gated by a permutation null — and it reads the policy half too, not only the prefix. A policy cell counts as skill when it (a) actually fires, (b) clears its family-wise permutation null — the max-over-cells (maxT) reference across the whole swept family, one shared shuffle scored at every cell — and (c) has aP(fail | fired)interval that clears the base failure rate. The family-wise correction applies to the AUROC null only: each cell'sP(fail | fired)interval is its OWN marginal challenge bootstrap (built from the same resamples as the not-fired arm, so the two are comparable). The precision clause therefore does NOT pay for the same selection the null does — the earlier design that gave every swept cell the family's max-over-cells precision reference was abandoned, because it handed a cell an interval that could exclude its own point estimate (the shipped cell once read0.421 [0.606, 0.788]). On the current corpus the gate clears at the edit-gatedescalate_after_n=3/stale_window=1000(AUROC 0.722 against the null 95% [0.5, 0.5499], adjusted p = 0.0005 over 2000 permutations), so the status isOK_OFFLINE_ONLYand the verdict names the winning cell (and its family), not a model. The policy null is a BLOCK permutation — whole challenge blocks are shuffled, so outcomes move between challenges while the global multiset is preserved — because this half's claim is unconditional and the exchangeable unit is the whole challenge. Only if no policy cell clears does the gate fall through to the prefix depths, which read the family-wise incremental AUROC null with the whole fitting pipeline re-run per shuffle. Labels are permuted within each challenge, never globally: a global shuffle destroys the challenge-level clustering of outcomes, which leaves the null and the observation with different amounts of headroom and the gate with no power. Otherwise the status isNO_SKILL(with the numbers and p-value in the reason),INSUFFICIENT_DATA, orAUTHENTICITY_FAILED, and every figure states it in red under the plot. A point estimate above 0.5 is never treated as skill on its own.deployabilitysays whether the number is one you could ship.statusanswers "is there a signal"; this answers "is the thing that found it a policy the router could run". It is mechanical, not editorial: every scored feature is checked against the fields a live escalation decision actually receives — the windowed failure log plus the ladder position — and the cadence the eval scored is checked against the one the router runs, a single decision per session. On the current corpus the verdict isOFFLINE-ONLY UPPER BOUND, becauseinfra_rateandmax_action_repeat_rateread step fields the live decision never sees and the sweep scores step boundaries. The label is printed understatus, carried in the JSON asdeployability, and stamped on every figure footer, so a result cannot be quoted as deployable by omission.- The counting mode is part of that verdict, not a footnote. The gate checks a third thing:
which recurrence counter produced the number.
as_shippedis the product's own — it reads nothing a live decision lacks.edit_gateddecides where the reproduction phase ends by matching each step's logged command, i.e. it readsaction, which is one of the offline-only step fields, and there is no counting knob inEscalationPolicyand nocount_from_first_editanywhere insrc/. So the canonical cell gets its own verdict, published beside the shipped one ascanonical_deployabilityand stamped as anEVAL-ONLY COUNTERlimitation on the three figures drawn from it (operating point, corpus & coverage, budget). This is derived, not asserted:actioncounts as unsupported because it is absent from the same production-context map the feature check reads, so if it ever became part of that context the mode would clear on its own. Before this it was prose in seven files and in no data structure, which is exactly how a figure came to carry a caveat saying the recurrence trigger read no such field while two of its panels were scored on a counter that did. - Two structural anti-leak rules. Features are read at a fixed absolute depth, never a
fraction of the run — a fraction needs the total length, which is future information. And
the terminal step is excluded, because the harness verdict is stamped onto it. Both are
pinned by tests; see
benchmark/escalation/features.py. - Grouped cross-validation by repository. Every challenge of a repository lands in the same
fold, so a held-out challenge never shares a repository with one in its index and the model
cannot rediscover task identity through the fold boundary. This guarded the
prefix model but not the task prior it was scored against: the prior was built from the
leave-one-out mean of each row's own challenge, so it read labels from its own test fold.
The published prior AUROC has been retracted (see
results.md). The comparison baseline is now estimated from train folds only over the same grouped partition, so it never reads a test row's own challenge; the leaked leave-one-out figure is still reported alongside, marked as a diagnostic contrast rather than the baseline. Because that honest prior scores below chance on this corpus, the increment is measured againstmax(prior, 0.5)— an anti-predictive baseline must not be beatable into an apparent finding. - The sweep varies
escalate_after_nANDstale_window— they are coupled._in_windowadmits at moststale_windowevents, so reaching n recurrences needs a window at least that wide. The grid spans n ∈ {1, 2, 3, 4, 5, 6, 8, 10, 12, 15, 20, 25, 30, 40, 50} ×stale_window∈ {10, 1000}; n=1 is kept so the mapping shows the floor (it degrades to the base rate), and the high end (40, 50) probes past the corpus's ~31-step median where the remaining precision is run-length selection.ladderis pinned: the detection metric reads whether the policy fired, not which rung it climbed, so it cannot move the headline. The shipped configuration (n=2,stale=10) is guaranteed a row, highlighted on the sweep table, and the report flags a better cell and never changes the shipped default. On this corpus thestale=10rows stop firing at n ≥ 12 — the window cannot hold enough recurrences — while thestale=1000rows reach a null-clearing edge at high n. - Runs with no per-step verified outcomes are excluded and counted. A trajectory the stamping stage never processed carries parser defaults, not evidence; including it would feed the model a collection-date proxy. The exclusion count appears in the JSON and in every figure footer.
- Figures. Six, documented one by one under Figures below: the detection decision, the operating point against both nulls, the full sweep table, the session-cadence value, the corpus and its confounds, and the budget ledger. Each PNG carries its claim, its sample size and — where a reader could be actively misled — one red line; the rest of what each one means is in its section here.
The harness runs on captured multi-step trajectories only. The recurrence trigger cannot
fire on a length-1 stream, and a prefix model needs a prefix, so the eval reads
benchmark/escalation/data/live/ (tracked via Git LFS, with a content-hash manifest.json
that fails CI if a label is tampered with). Point --live-dir elsewhere to score your own.
Capturing your own trajectories (opt-in, encrypted, local-only)
To evaluate the detector on your traffic, Shunt can record full-content per-step trajectories from live sessions. This is off by default and secure by construction:
router:
  capture:
    work_dir: /path/to/repo    # the off-wire verifier's repo (see Feedback)
    full_content: true         # opt in to full-content capture
    trajectory_dir: null       # null ⇒ a local dir OUTSIDE the repo ($SHUNT_HOME/trajectories)
When enabled it needs the capture extra (pip install -e '.[capture]' from a source
checkout) and an encryption key in SHUNT_ESCALATION_KEY (never commit it). Every free-text field is
redacted of secrets and then encrypted at rest before anything is written; capture
happens off the wire at the session boundary, never mid-turn, and never changes a routing
decision. The captured files stay local and git-ignored.
Before you share any of it, read this. A behaviour-only field whitelist
(COMMITTABLE_FIELDS, in benchmark/escalation/schema.py) names the fields that are
eligible to be published — the verified-outcome core and the numeric signals, no prose. But
nothing enforces it on the write path: the serializer writes every field, free text included,
and the projection function that applies the whitelist has no caller outside the tests. That
is what the trajectories shipped in this repo are — full action, args and result text on
every step, secret-redacted but not field-filtered. Redaction is the defence that actually
runs. If you publish your own capture, project it yourself; do not assume the whitelist did it
for you.
Figures
Each figure below is the PNG committed under docs/assets/figures/escalation/. The image carries its claim, its sample size and — where
a reader could be actively misled — one red line. The rest is here.
Who is in the sample, and whether the edge survives the confounds
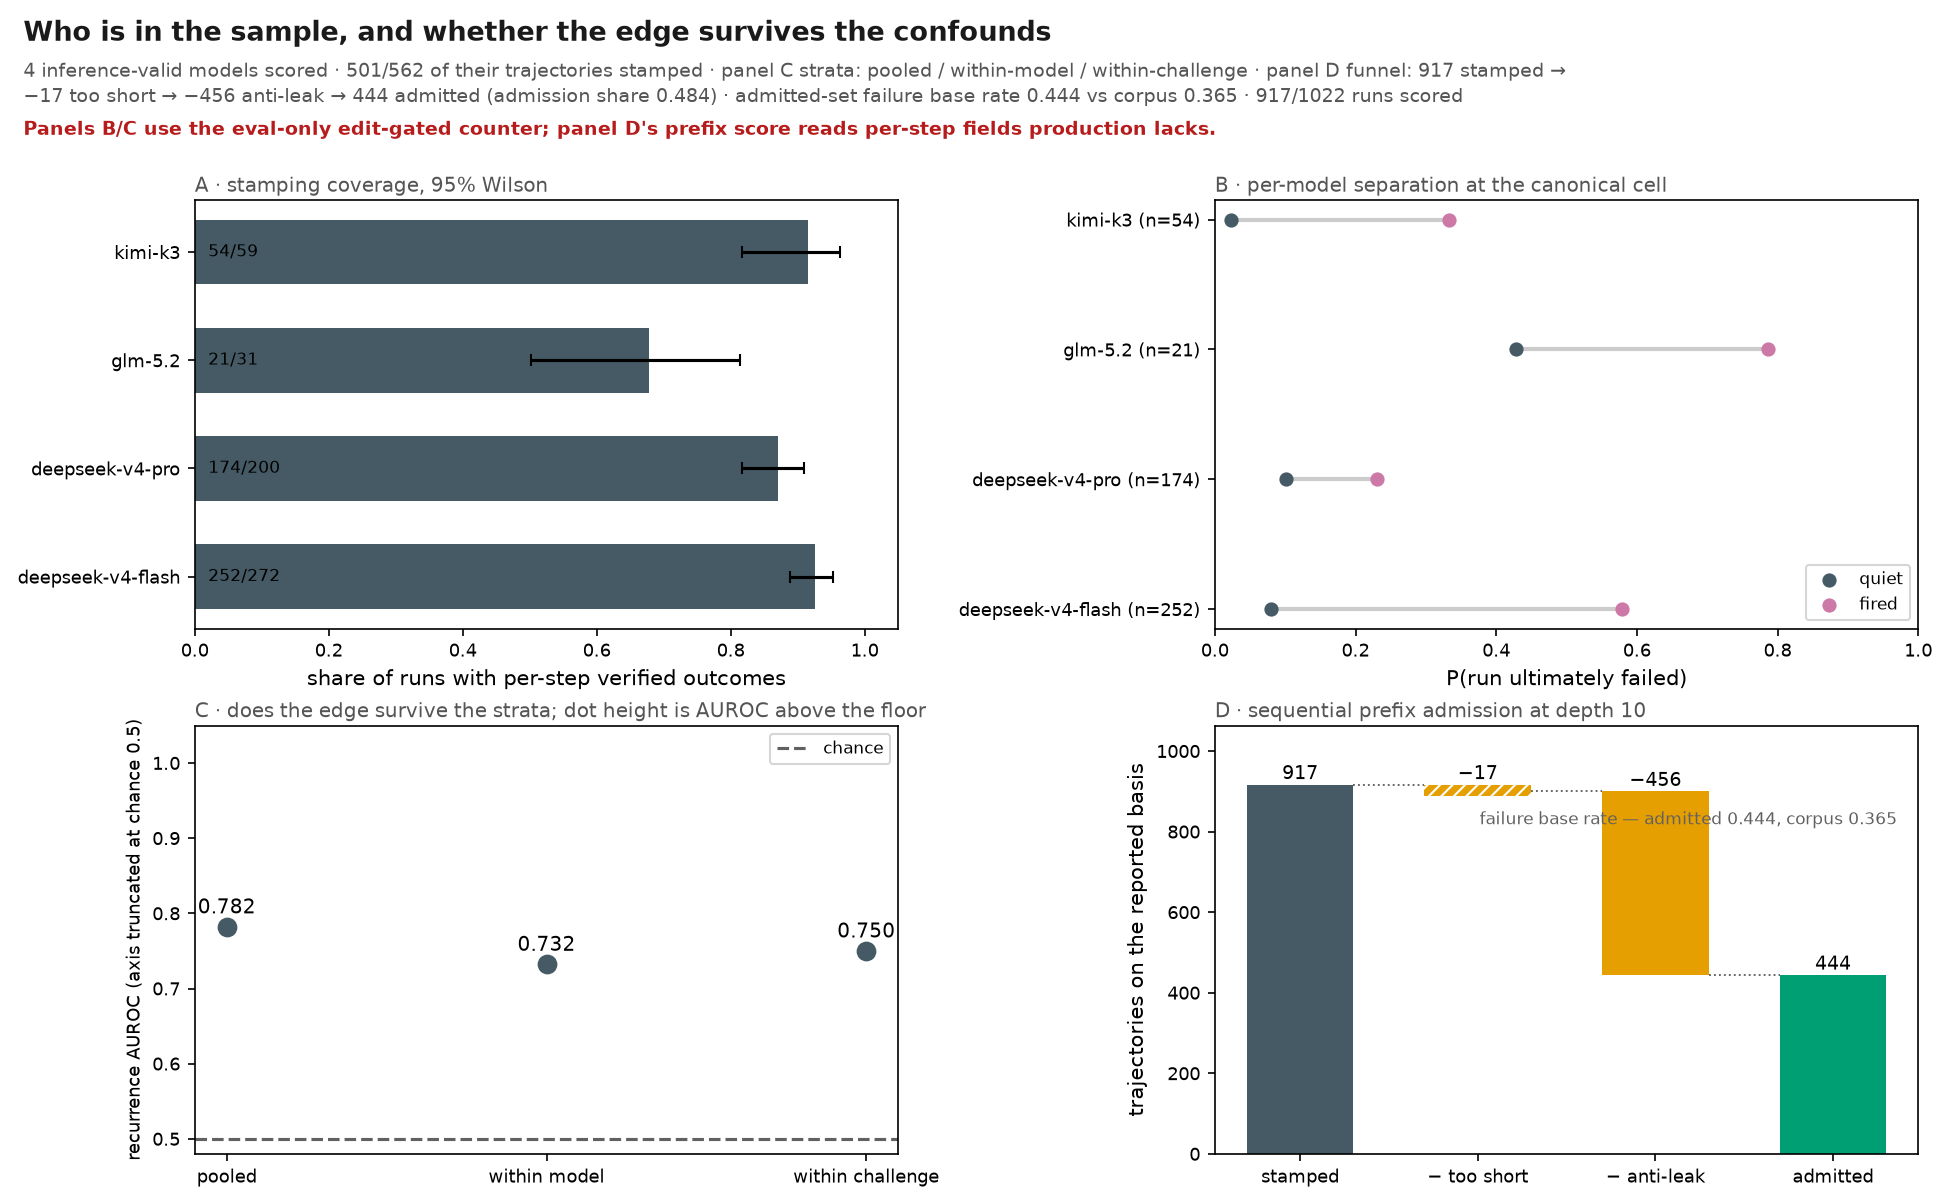
4 inference-valid models scored · 501/562 of their trajectories stamped · panel C strata: pooled / within-model / within-challenge · panel D funnel: 917 stamped → −17 too short → −456 anti-leak → 444 admitted (admission share 0.484) · admitted-set failure base rate 0.444 vs corpus 0.365 · 917/1022 runs scored
Caveat. Panels B/C use the eval-only edit-gated counter; panel D's prefix score reads per-step fields production lacks. Reading. A: the share of each model's trajectories that carry per-step verified outcomes, with 95% Wilson intervals and the counts printed — a run without them cannot fire the trigger at all and is excluded from every per-step metric. B: per model, P(run failed | fired) against P(run failed | quiet) at the canonical cell, drawn as a dumbbell; a model whose two ends coincide contributes no separation. C: the recurrence score's AUROC pooled, then computed WITHIN each model and WITHIN each challenge and pooled by comparable pairs — the drop between them is how much of the pooled number is the confound rather than the score; dots mark the values against the chance rule. D: the prefix risk model's SEQUENTIAL admission funnel at its reported depth — stamped, then the runs each filter removes, then the runs that survive — with the admitted population's failure rate against the corpus's.
What to look for. In C the within-strata dots must stay well above chance: if the pooled edge disappears once ranking happens inside a model or inside a challenge, the score is reading which model or which task the run belongs to. In D read the two failure rates against each other — an admitted population failing far more often than the corpus is a different population, and a null measured on it is a coverage gap, not a falsification.
Terms. stamped — the offline container replay wrote per-step verified outcomes for this run canonical cell — the eval-only edit-gated counter at the shipped knobs (panels B, C) within-model AUROC — ranked only against runs of the same model, pooled by pair count admission margin — runs that reached the depth but leave too few steps unread after it admitted-set failure base rate — share of the ADMITTED runs that ultimately failed — compared against the whole corpus's failure rate, never against the admission share insufficient evidence — a model under the minimum runs to score: named, never drawn or counted
Notes. Panel C's y axis is truncated at chance (0.5), not at zero, and its label says so: the panel asks how much SKILL ABOVE CHANCE survives the strata, and the half of the AUROC range below 0.5 is unreachable by a merely mis-signed score. Values are drawn as dots, not bars, because a bar is read from the axis floor and would make the confound drop the panel exists to size look larger than it is. A below-chance value drops the axis back to zero and relabels it. Panel D is a funnel, not four independent categories: each removal comes off the running total (stamped → minus too short → minus anti-leak → admitted). The too-short removal is drawn at a hatched minimum height because its true 17 is a sliver at print size. Stamping coverage tracks capture DATE, and capture date correlates with model, so model and coverage are confounded on this corpus and cannot be separated from it. A single-class stratum contributes no comparable pairs and is DROPPED from the within-strata AUROCs rather than scored at chance. AUROC pooled 0.782 · within-model 0.732 · within-challenge 0.750 Model labels are canonical weights slugs; the serving channel is a label, never part of the name. 917 scored trajectories, status=OK_OFFLINE_ONLY OFFLINE-ONLY UPPER BOUND — 2 feature(s) read fields absent from the production decision context (infra_rate, max_action_repeat_rate); scored at cadence 'step' while production decides once per 'session' canonical cell: OFFLINE-ONLY UPPER BOUND — the 'edit_gated' counter reads step fields absent from the production decision context (action), and the product has no such counting mode; 2 feature(s) read fields absent from the production decision context (infra_rate, max_action_repeat_rate); scored at cadence 'step' while production decides once per 'session'
Limits. Panel D's population is length-selected by construction: the anti-leak margin excludes every short run, and short runs resolve more often, so the admitted base rate is higher than the corpus's by design rather than by accident. 105/1022 trajectories have no per-step verified outcomes and are excluded from this figure. EVAL-ONLY COUNTER: this figure is drawn from the 'edit_gated' cell, which ignores failures before the agent's first edit-like action — a rule that reads action, a per-step field the live router never sees, and that no EscalationPolicy knob can ask for. The counter the product does run fires on almost every run and reads the base rate.
What firing costs: the eval-only edit-gated trigger pre-empts more than it interrupts
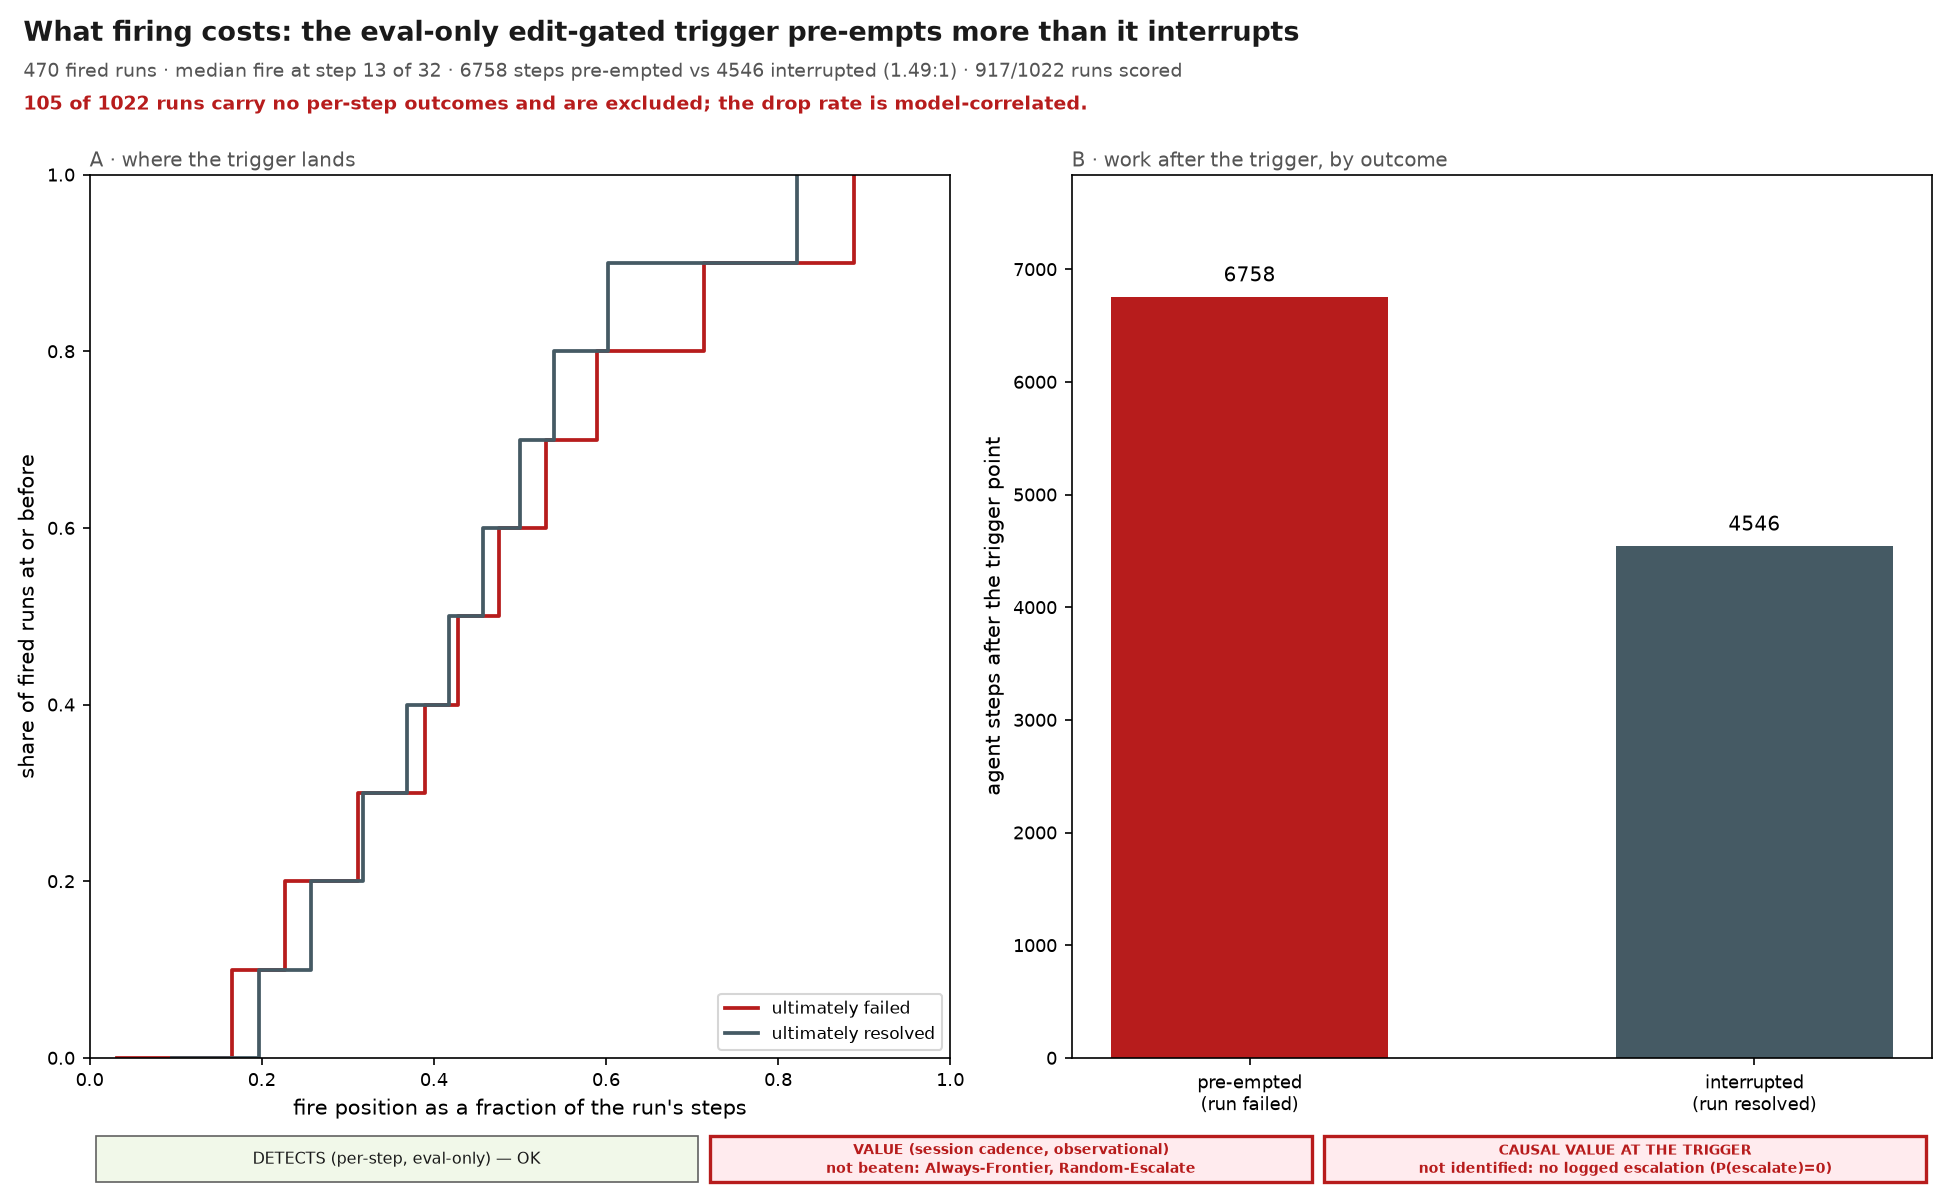
470 fired runs · median fire at step 13 of 32 · 6758 steps pre-empted vs 4546 interrupted (1.49:1) · 917/1022 runs scored
Caveat. 105 of 1022 runs carry no per-step outcomes and are excluded; the drop rate is model-correlated. Reading. Left: where in a run the trigger fires, as a fraction of the run's total steps, drawn as an ECDF for the runs that ultimately FAILED and for the runs that were RESOLVED. A curve that rises early means the trigger fires early in those runs. Right: the steps that sit AFTER the trigger point, totalled over every fired run and split by how the run ended. On a failed run that work was spent and lost, so escalating there PRE-EMPTS it; on a resolved run the agent went on to fix the task, so escalating INTERRUPTS work that was about to pay off. The ratio between the two bars is the trigger's budget case.
What to look for. Want the pre-empted bar clearly taller than the interrupted one — that ratio is what the trigger buys per unit of disruption. In the left panel, want the failed-run curve to the LEFT of the resolved one: firing earlier on the runs that were going to fail is the whole point.
Terms. edit-gated — failures before the agent's first edit-like action are not counted fire position — the step index the policy first escalated at, over the run's length pre-empted — steps after the trigger on runs that ultimately failed interrupted — steps after the trigger on runs that were ultimately resolved
Notes. Aggregates only. The per-run timing arrays these summarise are deliberately not kept: the same reasoning that deleted the lead-time figure — on this corpus a lead time is largely the run length minus a constant. Steps are agent decisions, not wall-clock and not dollars. This is a work ledger, not a cost estimate. median fire position 0.429 of the run on failed runs, 0.418 on resolved ones 917 scored trajectories, status=OK_OFFLINE_ONLY OFFLINE-ONLY UPPER BOUND — 2 feature(s) read fields absent from the production decision context (infra_rate, max_action_repeat_rate); scored at cadence 'step' while production decides once per 'session' canonical cell: OFFLINE-ONLY UPPER BOUND — the 'edit_gated' counter reads step fields absent from the production decision context (action), and the product has no such counting mode; 2 feature(s) read fields absent from the production decision context (infra_rate, max_action_repeat_rate); scored at cadence 'step' while production decides once per 'session' Limits. COUNTERFACTUAL BY ARITHMETIC, not by measurement: no logged trajectory escalated, so 'pre-empted' is what firing would have cut short assuming the run would otherwise have continued unchanged. See the scope strip. The ledger's ratio is driven mostly by ARM SIZE, not by timing: most of it is simply that more of the fired runs failed. Read it beside the fire-position panel, which is where a timing claim would have to come from — and where the two curves nearly coincide. 105/1022 trajectories have no per-step verified outcomes and are excluded from this figure. EVAL-ONLY COUNTER: this figure is drawn from the 'edit_gated' cell, which ignores failures before the agent's first edit-like action — a rule that reads action, a per-step field the live router never sees, and that no EscalationPolicy knob can ask for. The counter the product does run fires on almost every run and reads the base rate.
Counting the reproduction phase is what decides the answer: AUROC 0.600 vs 0.782
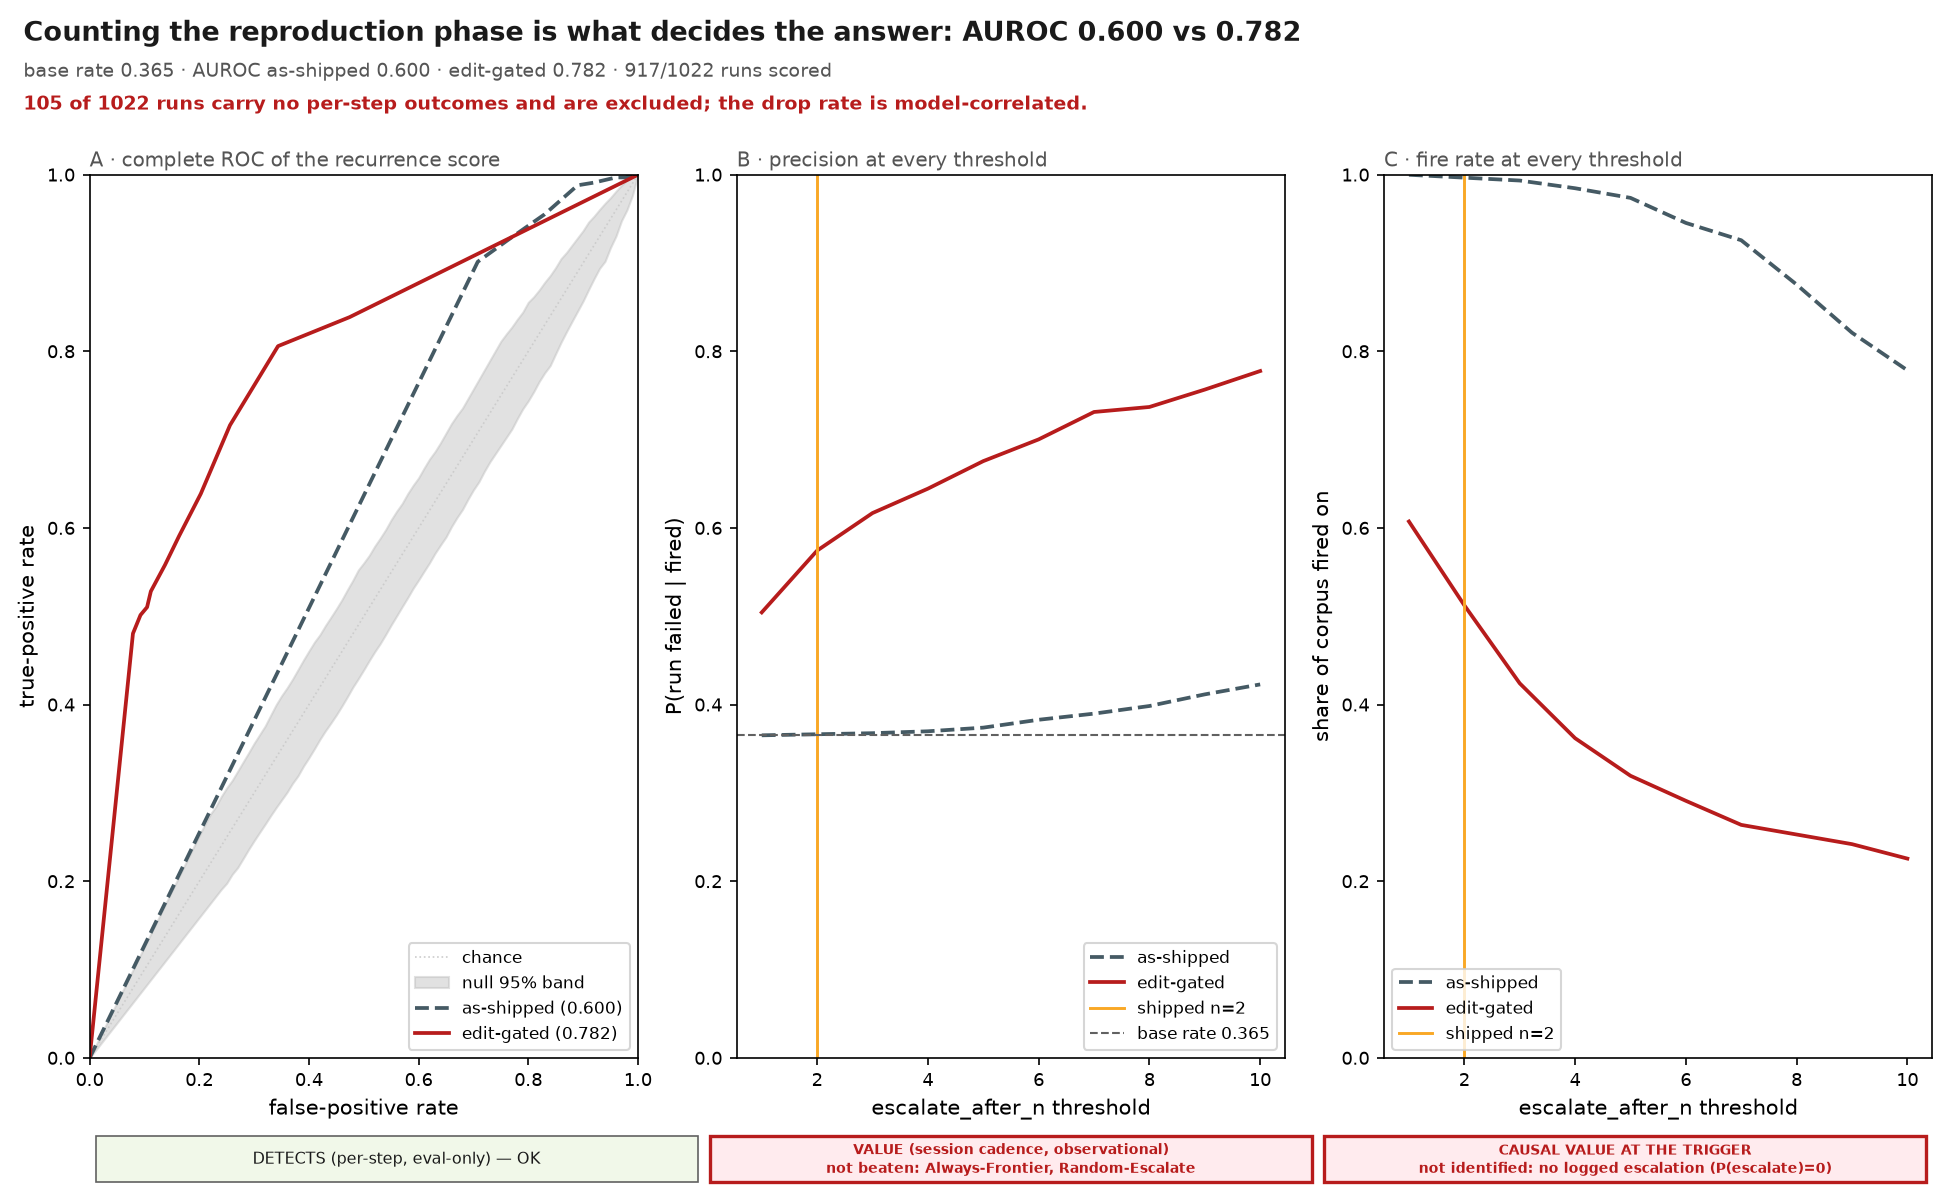
base rate 0.365 · AUROC as-shipped 0.600 · edit-gated 0.782 · 917/1022 runs scored
Caveat. 105 of 1022 runs carry no per-step outcomes and are excluded; the drop rate is model-correlated. Reading. Left: the COMPLETE ROC of the recurrence score as a continuous statistic — each run is scored by the largest number of times one failing-check id recurred inside the shipped stale_window, and the curve sweeps every threshold, so it has a point at every possible escalate_after_n rather than only the swept grid. Two curves: as-shipped (every same-key failure counted) and edit-gated (failures before the agent's first edit-like action are not counted). The grey band is the score's own challenge-block permutation null. Middle: P(run failed | score >= t) against t for both families, with the corpus base rate as the no-skill line. Right: what share of the corpus each threshold fires on. The shipped escalate_after_n is marked on both right-hand panels.
What to look for. The two curves must differ. If they do, the reproduction phase — not the recurrence mechanism — is what the as-shipped counter is measuring, and the gap between them is its size. Read the middle panel at the shipped threshold: the edit-gated precision there is the operating point every other figure in this set uses.
Terms. recurrence score — max same-key verified-failure count a run reaches in the window edit-gated — failures before the agent's first edit-like action are not counted null band — central 95% of ROC curves under challenge-block label shuffles
Notes. stale_window is held FIXED at the shipped value for BOTH curves. It is a knob in its own right — the window-sensitivity note below carries what each family reaches at the wide window — so letting it vary between the two curves would have credited the counting change with a window change. The AUROC of the score bounds what ANY single escalate_after_n can reach. score null 95% [0.475, 0.542], p=0.0005 over 2000 challenge-block shuffles window sensitivity, AUROC at the shipped stale_window vs stale_window=1000: as-shipped 0.600 -> 0.728 · edit-gated 0.782 -> 0.788 917 scored trajectories, status=OK_OFFLINE_ONLY OFFLINE-ONLY UPPER BOUND — 2 feature(s) read fields absent from the production decision context (infra_rate, max_action_repeat_rate); scored at cadence 'step' while production decides once per 'session'
Limits. Per-step cadence and eval-only: the live router has no per-step action stream to gate on, so the edit-gated family measures what a per-step detector could do, not what ships. Association only — no stored trajectory contains an escalation that actually happened. 105/1022 trajectories have no per-step verified outcomes and are excluded from this figure.
The shipped counter sits at the base rate; edit-gated counting separates outcomes
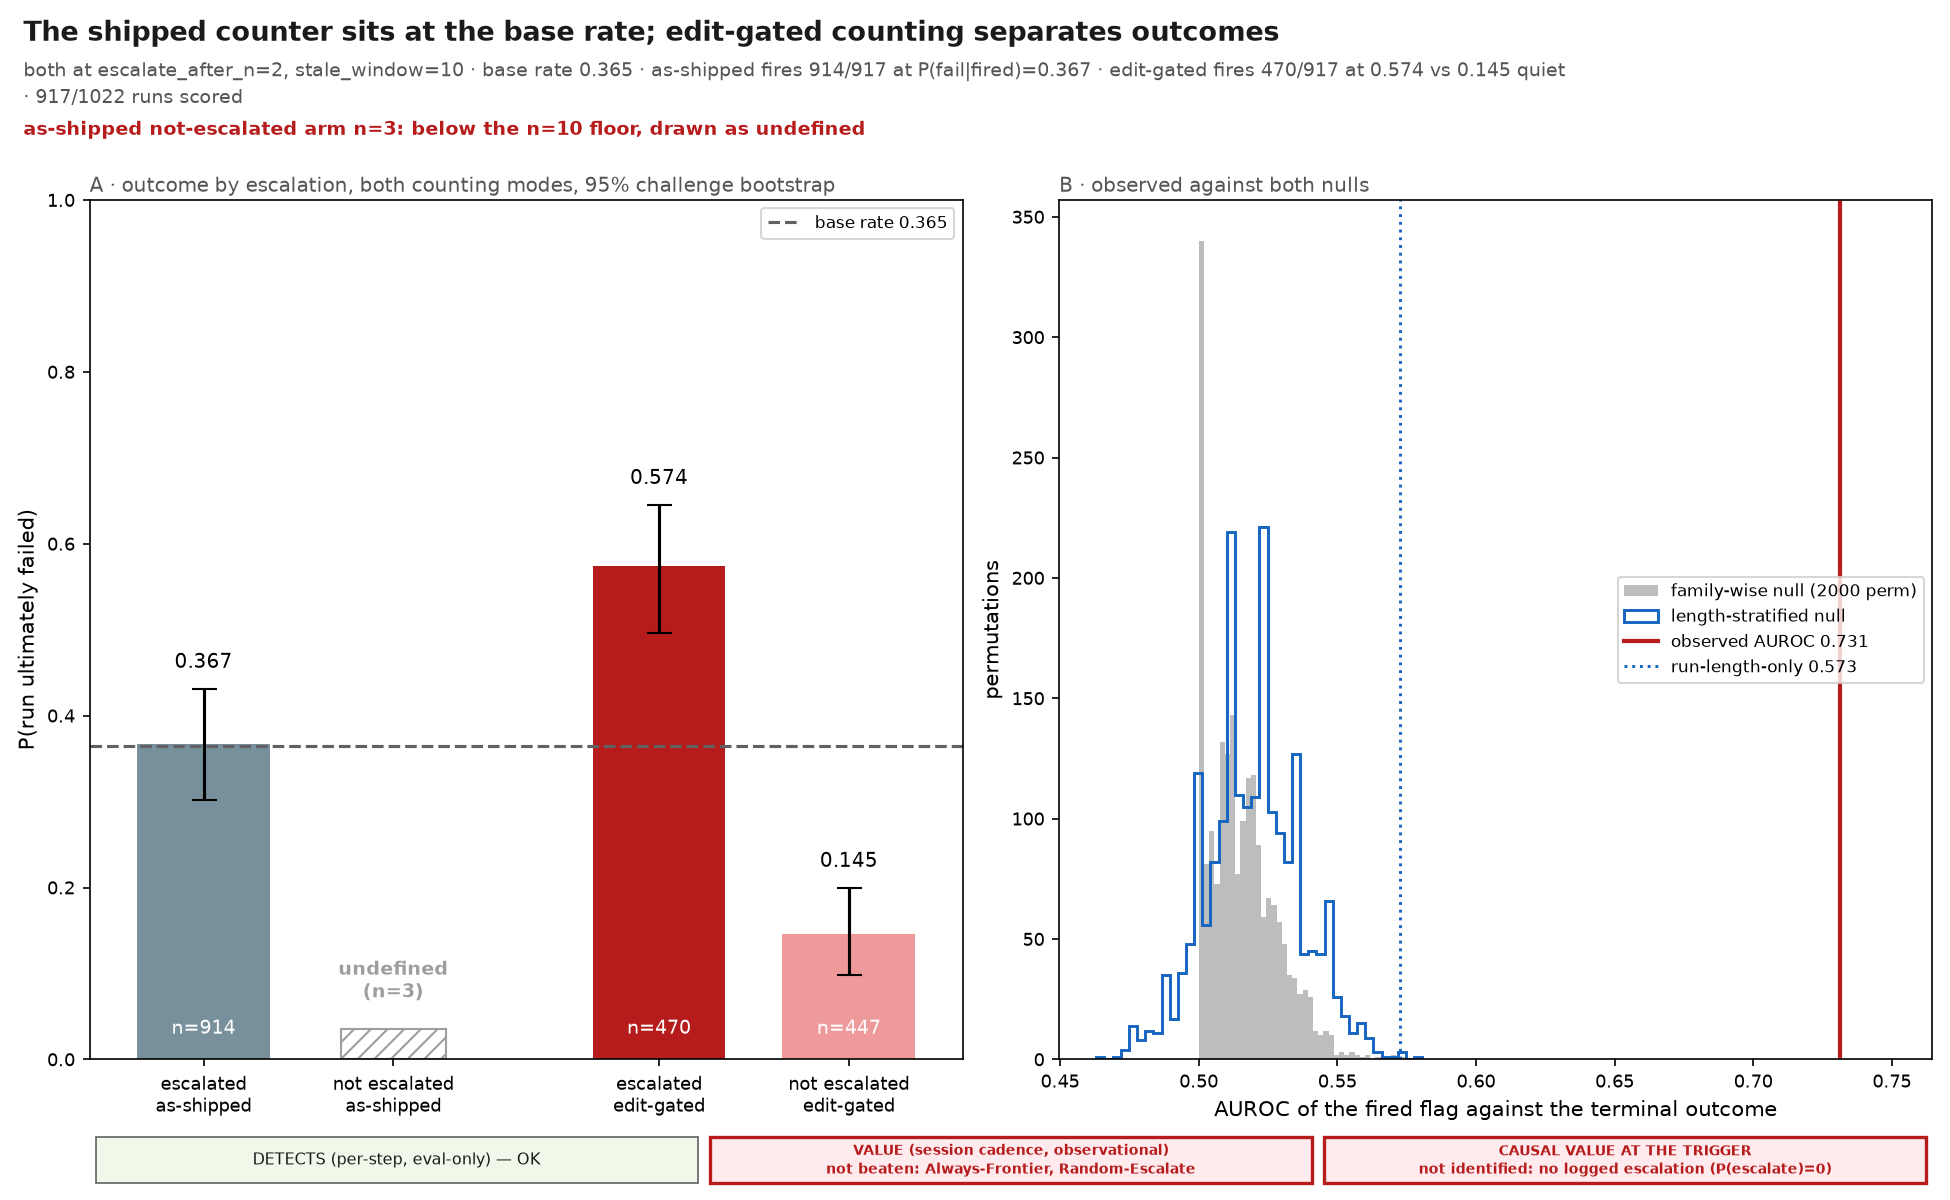
both at escalate_after_n=2, stale_window=10 · base rate 0.365 · as-shipped fires 914/917 at P(fail|fired)=0.367 · edit-gated fires 470/917 at 0.574 vs 0.145 quiet · 917/1022 runs scored
Caveat. as-shipped not-escalated arm n=3: below the n=10 floor, drawn as undefined Reading. Left: at the SAME shipped knobs, the share of runs that ultimately failed among those the policy escalated and among those it left alone — for BOTH counting modes. The left pair is the configuration the product actually ships, which fires on essentially every run: its escalated bar sits on the dashed base rate and its not-escalated arm holds so few runs that no rate can be read off it, so it is drawn as a short hatched baseline placeholder rather than as a measured 0.000. The right pair is the same rule with the reproduction phase excluded. Intervals are the central 95% of the same challenge-bootstrap resamples, so the two arms of a pair are paired draw-for-draw. Right: the CANONICAL (edit-gated) cell's AUROC against TWO nulls — the family-wise max-over-cells challenge-block null (grey), which asks whether any cell in the sweep could reach this by chance, and the length-stratified null (blue), which shuffles failures inside equal-count run-length bins and so asks whether firing predicts failure BEYOND what the lengths of the fired runs already predict.
What to look for. The left pair IS the negative result and it belongs on a canvas, not in a table row: a shipped configuration whose escalated bar sits on the base rate is a null detector. Then want the right pair's escalated bar clearly above both the dashed line and its own quiet bar, and the red observed line to the right of BOTH null distributions. Clearing the grey null alone is not enough: the challenge-block shuffle destroys the run-length association along with everything else, so a cell whose firing is really length selection can clear it and still sit inside the blue one.
Terms. as-shipped — every same-key verified failure counts, which is what production runs canonical cell — edit-gated counting at the shipped escalate_after_n/stale_window family-wise null — max AUROC over the swept cells under one shared block shuffle length-stratified null — failures shuffled within equal-count run-length bins
Notes. Both pairs are at the SAME knobs, so the only thing that differs between them is how the counter treats the reproduction phase. The intervals are a CHALLENGE-level bootstrap: the corpus is drawn from ~166 challenges, each attempted by several model/effort arms, so a row-level interval is roughly 2x too narrow. as-shipped at escalate_after_n=2, stale_window=10; fired on 914/917; P(fail|fired)=0.367 [0.302, 0.431] vs quiet 0.000; AUROC 0.503 against a run-length-only 0.502 edit-gated at escalate_after_n=2, stale_window=10; fired on 470/917; P(fail|fired)=0.574 [0.496, 0.645] vs quiet 0.145; AUROC 0.731 against a run-length-only 0.573 917 scored trajectories, status=OK_OFFLINE_ONLY OFFLINE-ONLY UPPER BOUND — 2 feature(s) read fields absent from the production decision context (infra_rate, max_action_repeat_rate); scored at cadence 'step' while production decides once per 'session' canonical cell: OFFLINE-ONLY UPPER BOUND — the 'edit_gated' counter reads step fields absent from the production decision context (action), and the product has no such counting mode; 2 feature(s) read fields absent from the production decision context (infra_rate, max_action_repeat_rate); scored at cadence 'step' while production decides once per 'session' Limits. Association, not causation — see the scope strip: no logged trajectory escalated. Two operating points; the sweep figure shows every other configuration. 105/1022 trajectories have no per-step verified outcomes and are excluded from this figure. EVAL-ONLY COUNTER: this figure is drawn from the 'edit_gated' cell, which ignores failures before the agent's first edit-like action — a rule that reads action, a per-step field the live router never sees, and that no EscalationPolicy knob can ask for. The counter the product does run fires on almost every run and reads the base rate.
Every swept configuration, in both counting modes, against one base rate
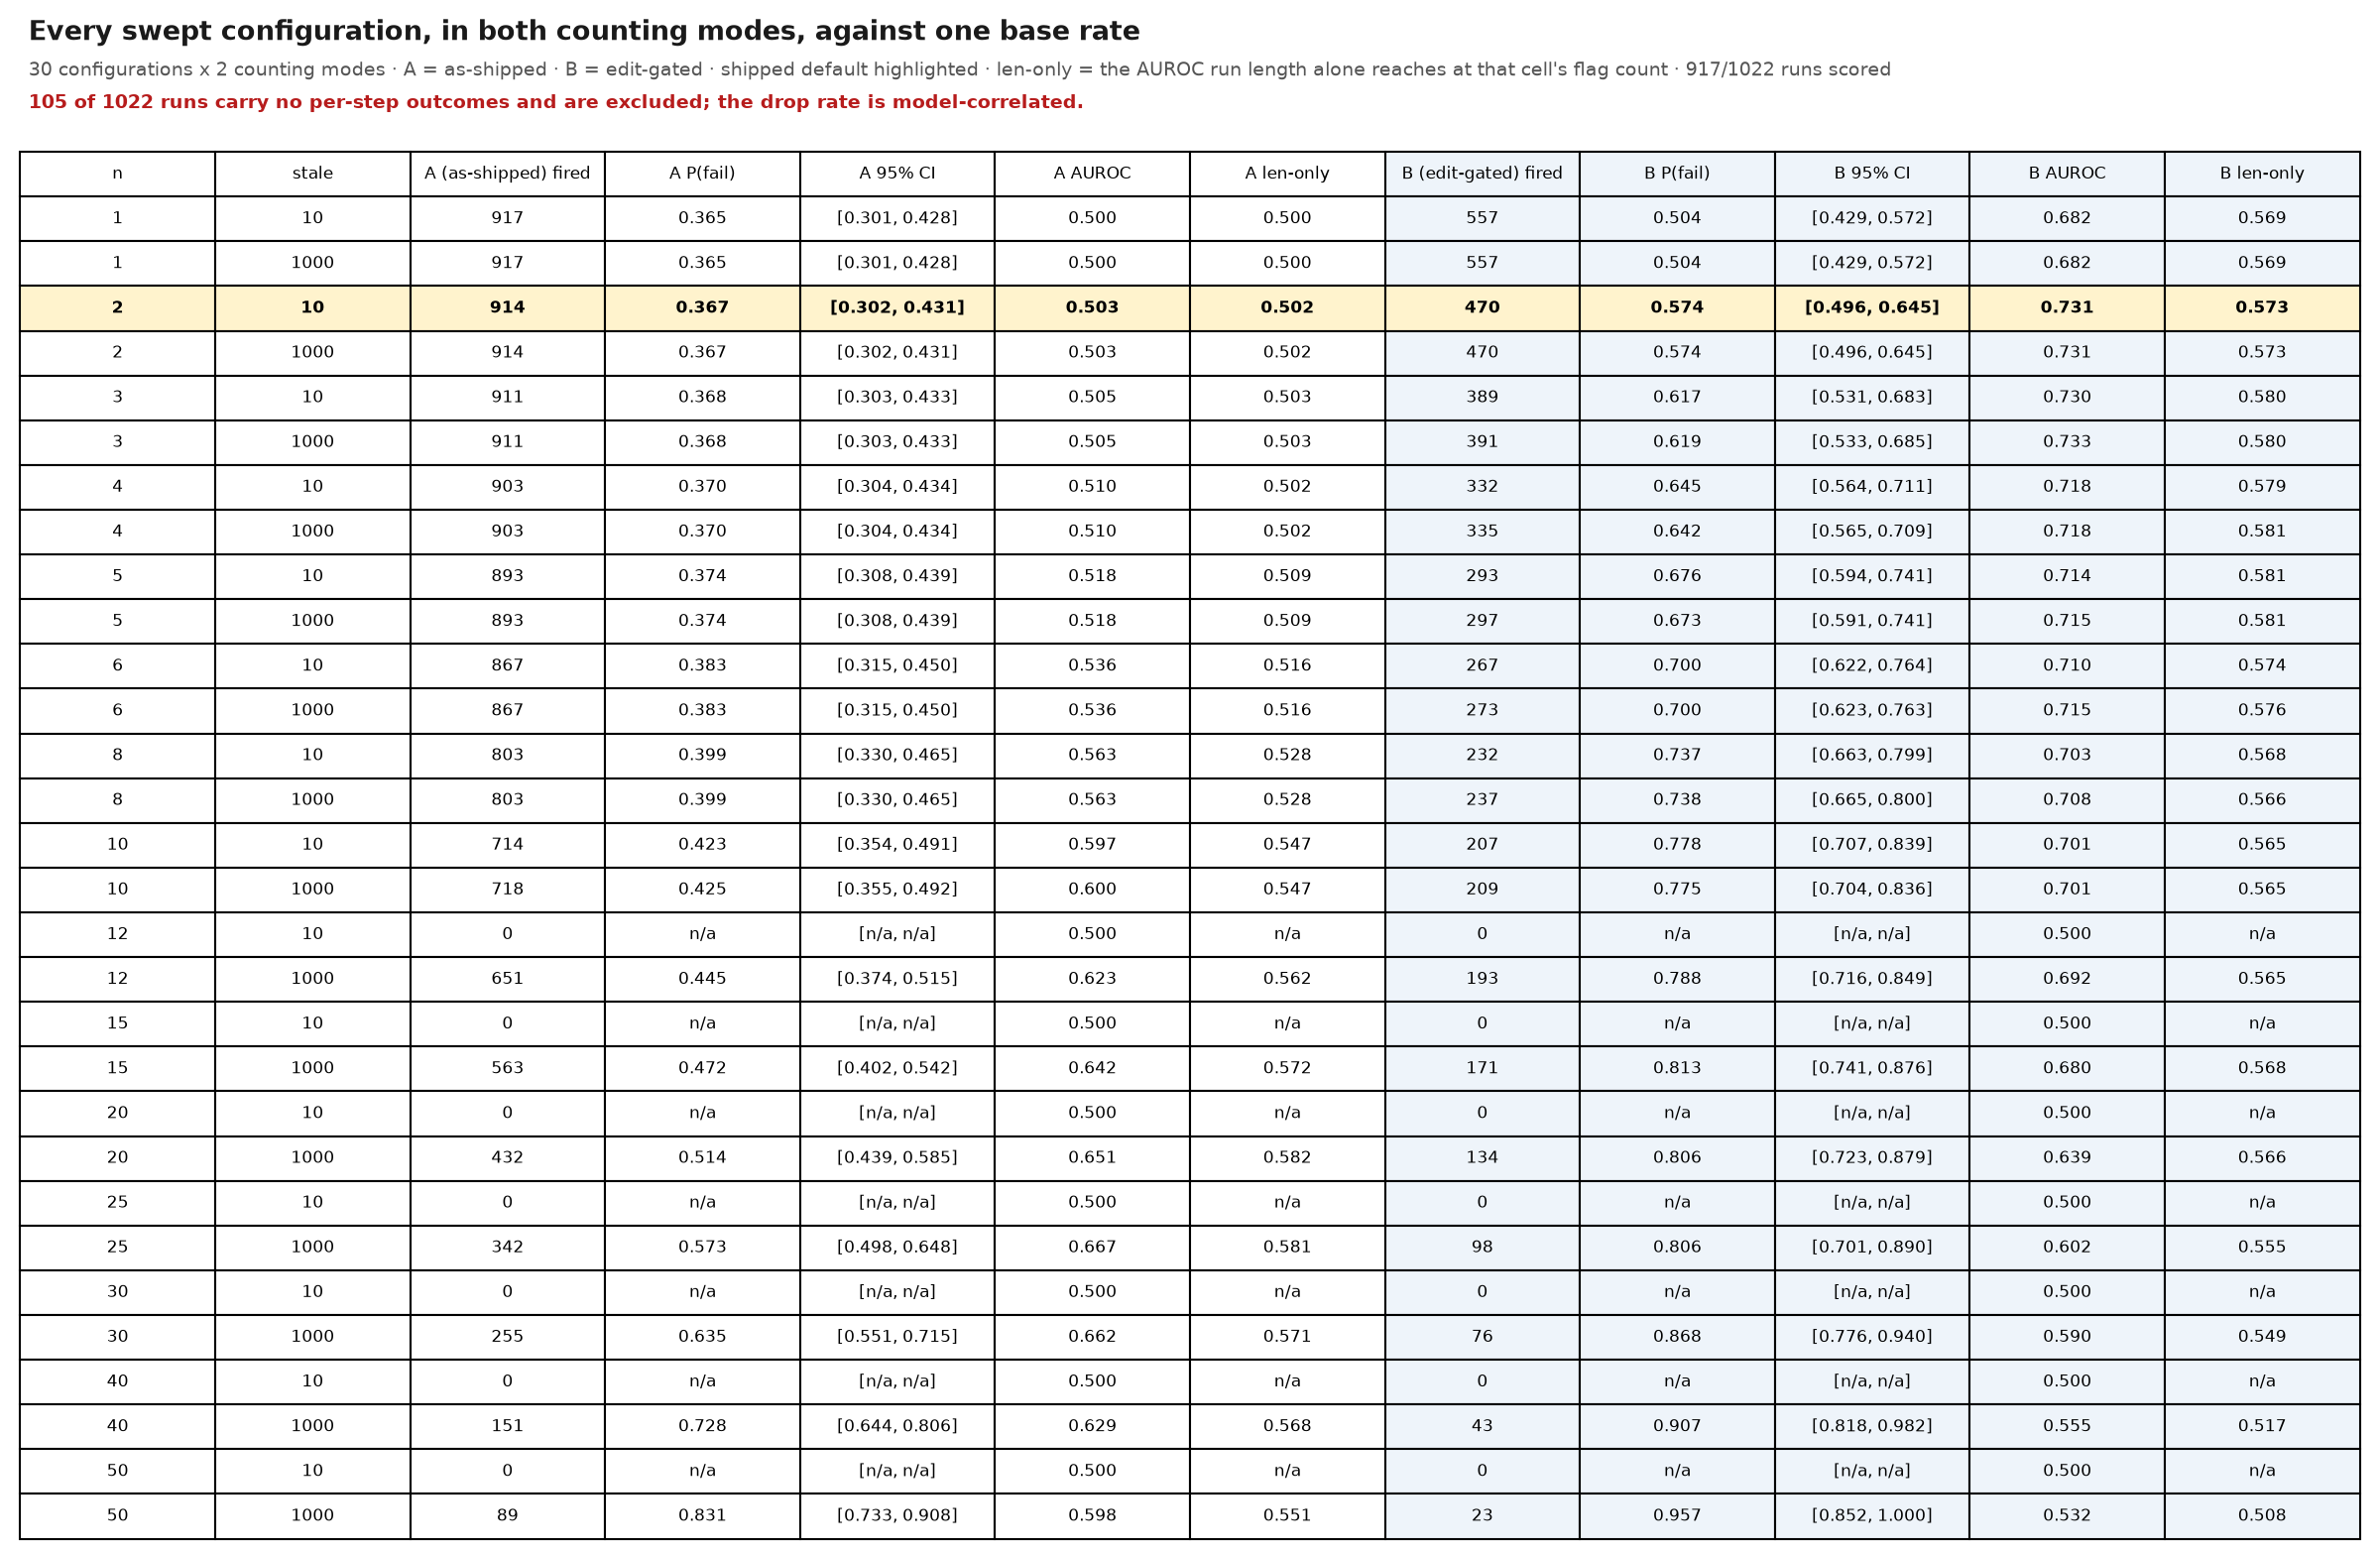
30 configurations x 2 counting modes · A = as-shipped · B = edit-gated · shipped default highlighted · len-only = the AUROC run length alone reaches at that cell's flag count · 917/1022 runs scored
Caveat. 105 of 1022 runs carry no per-step outcomes and are excluded; the drop rate is model-correlated. Reading. One row per configuration of the two coupled knobs — escalate_after_n and stale_window, with the escalation ladder pinned to the shipped one. The A columns are as-shipped counting (every same-key verified failure counts); the shaded B columns are the same configuration with the reproduction phase excluded, i.e. failures before the agent's first edit-like action are not escalation evidence. Per family: how many trajectories the cell fired on, P(run failed | fired), and the AUROC of the fired flag against the terminal outcome. The row that IS the shipped default is highlighted.
What to look for. Compare the A and B columns row by row. A configuration whose P(fail|fired) sits at the base rate has no measured value at all; the gap between the A and B columns of the SAME row is the reproduction phase's contribution, isolated from every other knob. The two knobs are coupled — reaching n recurrences needs a window at least that wide — which is why the stale_window=10 rows stop firing above n=10.
Terms. A — as-shipped counting B — edit-gated counting (failures before the first edit excluded) P(fail) — share of the runs this cell fired on that ultimately failed len-only — the AUROC a pure 'run length >= t' predictor reaches at THIS cell's flag count — the ceiling run length alone can explain, so an AUROC no higher than it is length selection rather than recurrence
Notes. The table is drawn rather than plotted because the sweep has too few distinct results to carry a colour channel honestly. The interval is the CHALLENGE-level bootstrap, not a Wilson interval over rows: the corpus is drawn from ~166 challenges, so rows are not independent draws and a row-level interval is roughly 2x too narrow. 30 configurations per family; highest P(fail|fired) is 0.957 at edit-gated escalate_after_n=50 (stale_window=1000) against a base rate of 0.365 917 scored trajectories, status=OK_OFFLINE_ONLY OFFLINE-ONLY UPPER BOUND — 2 feature(s) read fields absent from the production decision context (infra_rate, max_action_repeat_rate); scored at cadence 'step' while production decides once per 'session' Limits. Every number here is unadjusted for the 60 configurations compared side by side; the family-wise correction lives in each cell's null, not in this table. A configuration that never fires has no P(fail|fired) at all and prints n/a. 30 of 60 configurations across both families clear the base failure rate; every other cell in this table does not. 105/1022 trajectories have no per-step verified outcomes and are excluded from this figure.
Escalating beats a cheap retry, but not Always-Frontier or Random-Escalate
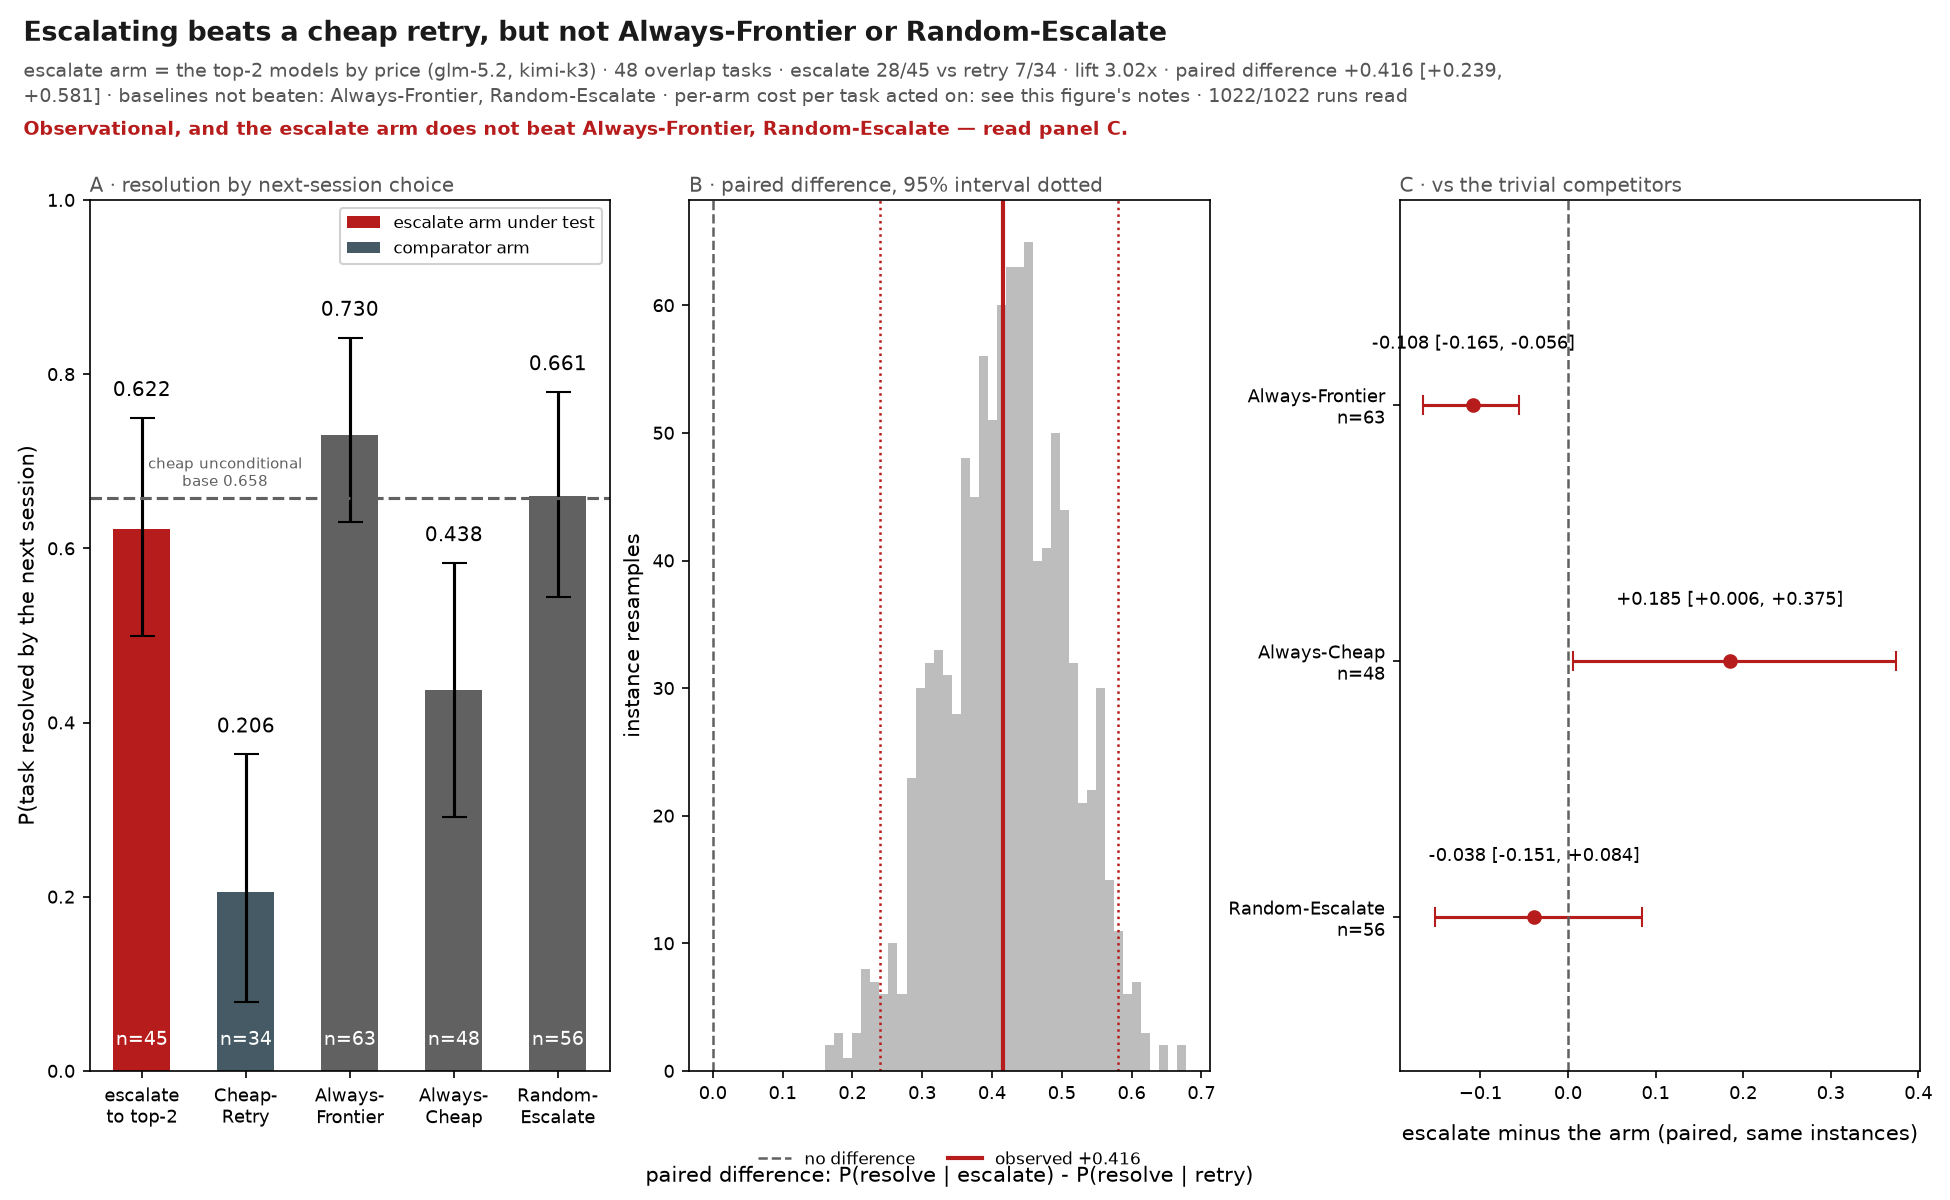
escalate arm = the top-2 models by price (glm-5.2, kimi-k3) · 48 overlap tasks · escalate 28/45 vs retry 7/34 · lift 3.02x · paired difference +0.416 [+0.239, +0.581] · baselines not beaten: Always-Frontier, Random-Escalate · per-arm cost per task acted on: see this figure's notes · 1022/1022 runs read
Produced by benchmark/escalation/session_eval.py (session_cadence) and
benchmark/escalation/plots.py (session_value) over the committed corpus — the caption is
generated from the data, so its counts and lift are re-derivable, not editorial.
Caveat. Observational, and the escalate arm does not beat Always-Frontier, Random-Escalate — read panel C. Reading. Read on EVERY trajectory in the corpus, not the per-step-stamped subset the other escalation figures score: a session outcome comes off the run header, so a run without per-step stamps still counts here. Measured on the overlap subset — tasks carrying BOTH a second cheap session and a frontier session, so every arm is read on the same tasks. Left: after a cheap session failed a task, the share of FRONTIER sessions on that task that resolved it (escalate) against the share of a SECOND cheap session that resolved it (retry). Both intervals resample whole INSTANCES, because several frontier sessions on one task are not independent draws. Middle: the PAIRED difference, escalate minus retry, on those same instance resamples, with its 95% interval and zero marked. Right: the same paired difference against the three trivial competitors — never being cheap (always frontier), never escalating (always cheap), and firing at random at the escalate arm's own rate.
What to look for. The middle panel decides escalate-vs-retry; the right panel decides whether the ladder is worth having at all. A point left of zero there is a competitor the escalate arm does not beat. Neither panel is about the shipped ladder's rungs — the arm drawn here is the corpus's most expensive models, which the ladder reaches last, if at all.
Terms. cheap — the cheapest model present — the base pick and the retry counterfactual overlap subset — tasks with >=2 cheap sessions AND a frontier session always frontier — the frontier session's outcome, whatever the cheap sessions did always cheap — the first cheap session's outcome, unconditionally random escalate — escalation fired on a seeded subset sized to the real fire rate rung — a model the ladder can step to; the shipped shortlist walks the cheapest ranks one at a time and then jumps to the top rank frontier — the 2 most expensive models present in the corpus: glm-5.2, kimi-k3
Notes. At session cadence the detector is trivially satisfied — the failed cheap session carries the task's target failing-check id — so this measures the LADDER's value, not the trigger's detection quality. The dashed line is the cheap model's UNCONDITIONAL base rate. The bars condition on a cheap failure on the same task, so the line is not a ceiling for them. instance-level bootstrap over 48 overlap tasks, not Wilson over sessions: several frontier sessions on one task are one draw, not several the shipped ladder (rank_shortlist=3) walks deepseek-v4-pro -> glm-5.2 -> claude-fable-5 over the shipped pool's price order: of the escalate arm it reaches glm-5.2, and never reaches kimi-k3, stepping through deepseek-v4-pro, claude-fable-5 first USD per task acted on (naive): escalate 0.554 (0.91/marginal) · Cheap-Retry 0.022 (0.05/marginal) · Always-Frontier 0.566 (1.49/marginal) · Always-Cheap 0.009 · Random-Escalate 0.367 (1.37/marginal) USD per task acted on (cache-aware): escalate 0.554 (0.91/marginal) · Cheap-Retry 0.011 (0.01/marginal) · Always-Frontier 0.566 (1.49/marginal) · Always-Cheap 0.009 · Random-Escalate 0.363 (1.36/marginal) cost is the provider's billed real_cost joined per (task, model, reasoning); an arm pays for the sessions it had to run first, so the escalate arm carries its failed cheap session. 'naive' is CACHE-BLIND — it charges a repeated model as if its prefix were cold; 'cache-aware' applies the shared cache model, whose hit rate is assumed, not measured. USD per marginal resolve is against the always-cheap floor, on that arm's own tasks — and the escalate arm's tasks are the fired subset, not the whole overlap set. 1022 trajectories read at session cadence (per-step stamping not required), status=OK_OFFLINE_ONLY Limits. Observational: the arms ran in parallel and which tasks got frontier coverage was adaptive. Small n — read the interval, not the point estimate. THE ESCALATE ARM IS NOT THE SHIPPED LADDER. It is the most expensive models in the corpus, and the shipped ladder does not step straight to them: it buys the cheapest ranks first and only then jumps, and those intermediate rungs are measured separately on the routing corpus as null or net-harmful. Read this as the value of escalating TO THIS ARM, never as what the shipped default achieves. The escalate arm conditions on a cheap failure; the always-frontier and always-cheap arms do not, so they also cover tasks the cheap model already resolved. Scored on ALL 1022 trajectories, not the 917-run per-step-stamped subset the other escalation figures use: a session outcome is read from the run header, so an unstamped run is still scorable here.